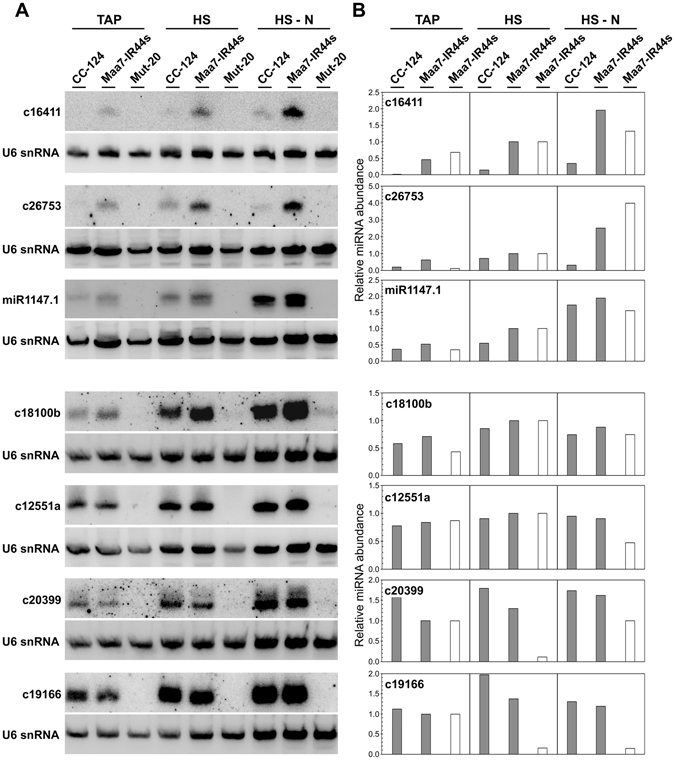
Figure 2.

Northern blot analysis of miRNA expression in Chlamydomonas cells grown under the denoted trophic conditions. (A) Small RNAs were detected with probes specific for the indicated miRNAs. The same filters were reprobed with the U6 small nuclear RNA sequence as a control for lane loading. CC-124 wild type strain; Maa7-IR44s, CC-124 containing a transgene expressing FLAG-tagged AGO3; Mut-20, TSN1 deletion mutant, in the Maa7-IR44s background, defective in sRNA biogenesis14. (B) Relative miRNA levels in the indicated strains under the different trophic conditions. Values shown are the average of two independent experiments and are normalized to those of the Maa7-IR44s strain grown photoautotrophically in nutrient replete minimal medium (HS). For c20399 and c19166, values are normalized to those of Maa7-IR44s grown mixotrophically in acetate containing medium (TAP). The relative standard deviation, as percentage of the mean, was in no case higher than 28.3%. Data corresponds to phosphorimager measurements of sRNA signals on northern blots (gray bars) or normalized read counts from the AGO3-associated sRNA libraries (white bars).
