Figure 3.

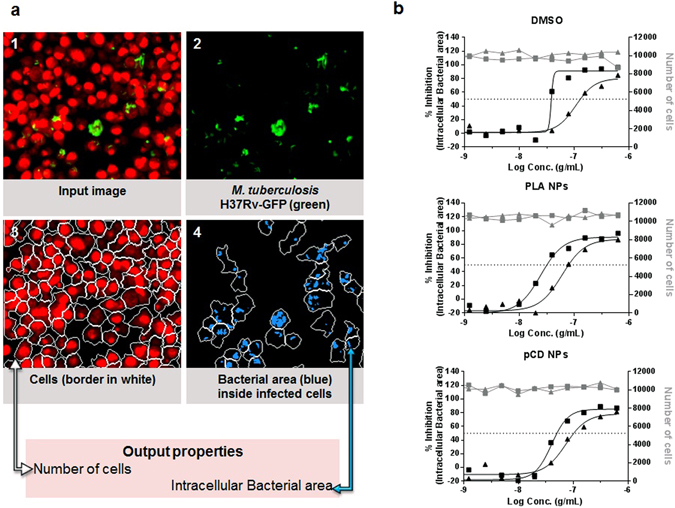
Intracellular antitubercular activity. (a) Scheme representing image-based analysis method performed with the image-analysis software Columbus 2.5.1 (PerkinElmer). 1. Input image: cell nuclei and cell cytoplasm were stained with the DNA dye Syto60 and detected in the red channel; M. tuberculosis H37Rv-GFP was detected in the green channel. 2. M. tuberculosis H37Rv-GFP detected in the green channel. 3. Cells detection in the red channel. The estimated cell limit is represented in white. 4. Bacterial area detected inside the cells area is represented in blue. Data related to the area of cells was detected in the red channel and data related to the bacterial area was detected in the green channel. (b) % of inhibition of intracellular bacterial area (black points) and number of cells (grey points) obtained with ETH (solid triangle) and [ETH:Booster] (solid square) in DMSO, PLA NPs and pCD NPs. Data presented corresponds to one representative experiment of three experiments.
