
Figure 2.
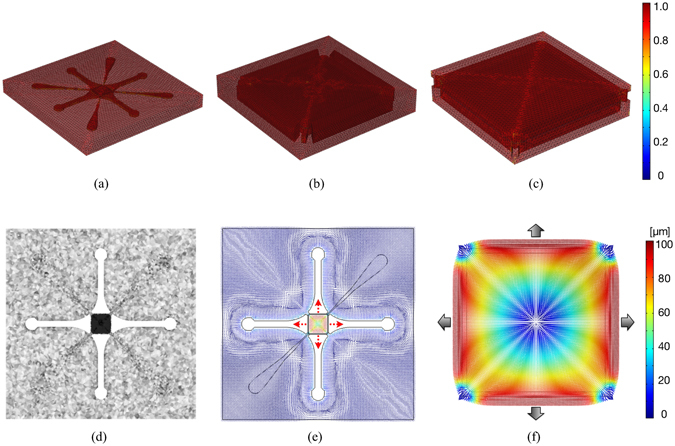
Computational model. (a–c) Mesh element quality distribution over the entire MCD (a) and two progressive zoomed views of the culture chamber (b,c). Colour code refers to tetrahedral mesh quality (1 represents the highest quality). (d,e) Mesh distribution (d) and arrow plot of the displacement field (e) along the mid-planar section for the entire device. (f) Zoomed view on the displacement field on the PM (the equibiaxial loading case is highlighted by pressure arrows).