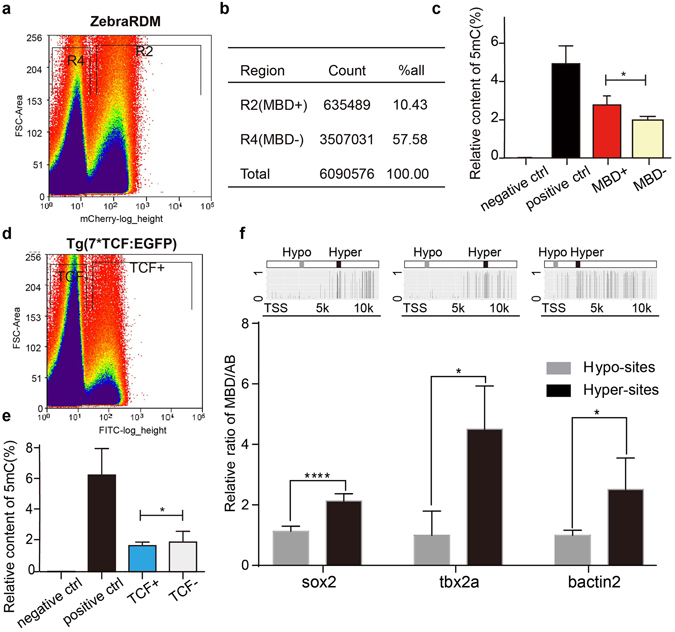
Figure 4.

Differential methylated cells and gene loci recognized by the probe mCherry-MBD. (a) The mCherry fluorescence dot plot of cells in zebraRDM. R2, MBD+ group; R4, MBD− group. (b) Cell numbers and proportion of sorted cells. (c) Columns represent the percentage of 5 mC in DNA isolated from the MBD+ and MBD− groups (P = 0.026). (d) The GFP fluorescence dot plot of Wnt-responsive cells. (e) Columns represent the percentage of 5 mC in DNA isolated from TCF+ and TCF− groups (P = 0.0489). (f) The Chip-qPCR results of three genes′ hypo-/hyper-methylated sites. The images above are schematic pictures of three genes’ methylation status and their hypo-/hyper-methylated sites’ position. Columns represent the content of specific sites’ DNA fragment, normalized to the AB control. TSS, transcription start site; Hypo-sites, hypo-methylated sites; Hyper-sites, hyper-methylated sites.
