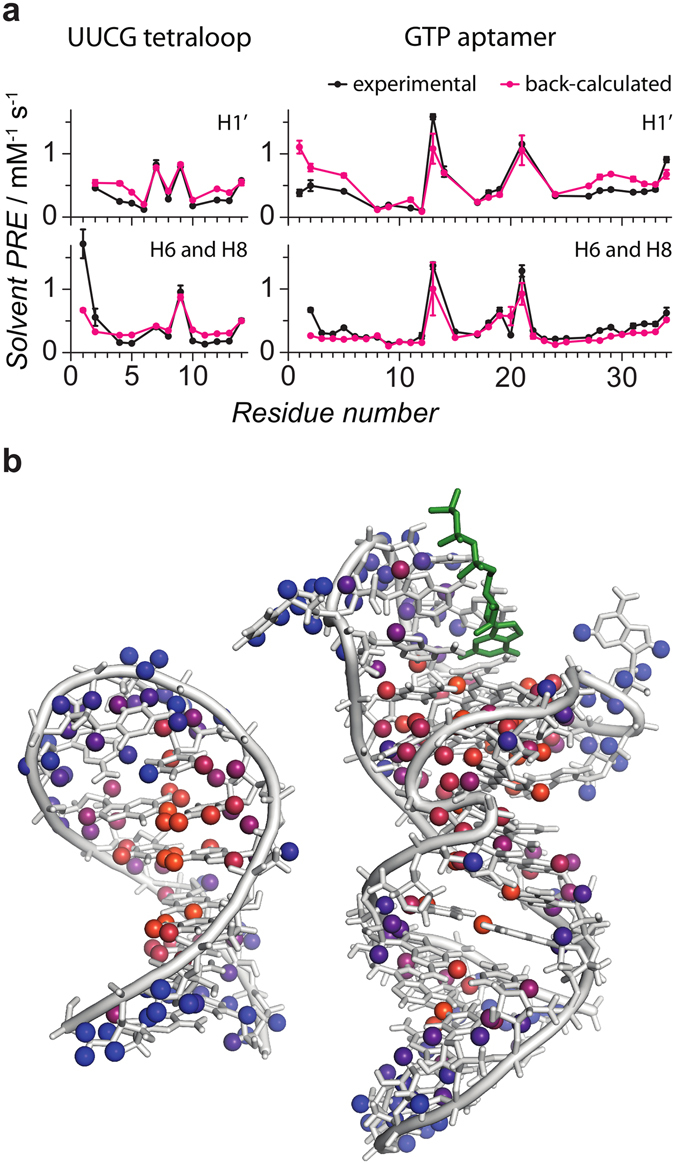
Figure 2.

sPRE data correlates well with RNA structure. (a) Experimental sPRE data (black) are compared to predicted sPRE data based on NMR solution structures of the UUCG tetraloop (2KOC) and the GTP-bound aptamer (5LWJ). Data are shown for sugar protons (H1′) and aromatic protons (H6 and H8) as indicated. (b) NMR solution structures of the UUCG tetraloop37, 38 (2KOC, left) and the GTP-bound aptamer39, 40 (5LWJ, right, heavy atoms of GTP ligand shown in green) are shown. All protons for which a sPRE value was obtained are shown as spheres and colored according to the sPRE (blue corresponding to high and orange corresponding to low sPRE values).
