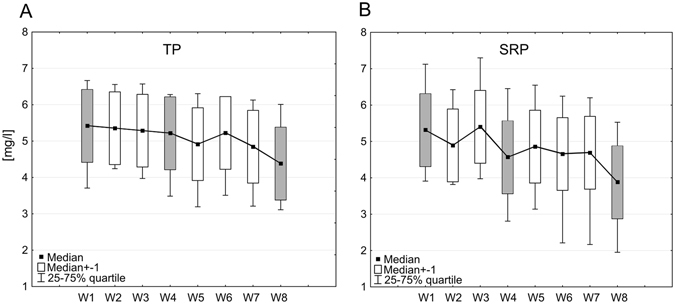
Figure 3.

Concentrations of TP (A) and SRP (B) in wastewater outflowing from the WWTP (W1), then inflowing to the geochemical beds (W2–W4) and macrophyte beds (W5–W8) of the Sequential Biofiltration System, and then undergoing treatment. The shaded boxes represent the parameters of wastewater at: W1–inflow into the SBS, W4–below the geochemical barrier (below filtration beds), W8–below the plant barrier with macrophytes Thirty-six samples were taken from each of eight stations, total number of analysed samples = 288.
