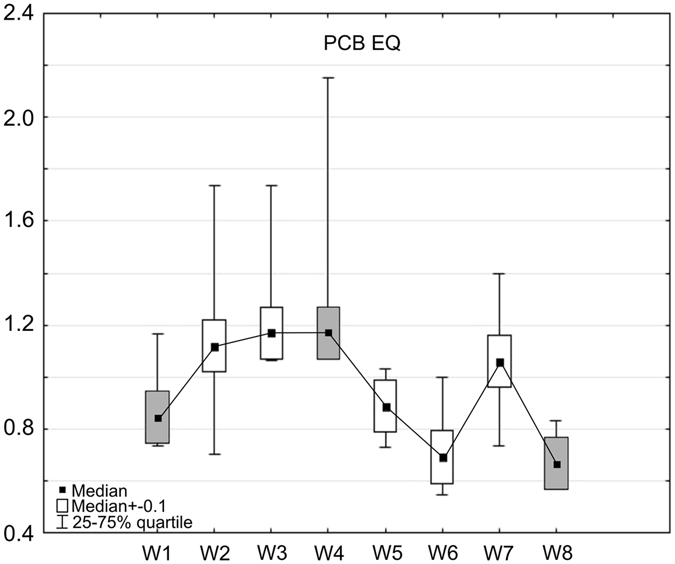
Figure 5.

Concentrations of PCB EQ [µg dm−3] in wastewater effluent from WWTP (W1) and when entering particular geochemical (W2–W4) and macrophyte beds (W5–W8) of the Sequential Biofiltration System. Shaded boxes represent parameters of wastewater at: W1–inflow into the SBS, W4–at a point below the geochemical barrier (below filtration beds), W8–at a point below the macrophyte barrier. Five samples were taken at W1–W4 and four samples at W5–W8 stations, total number of analysed samples = 36).
