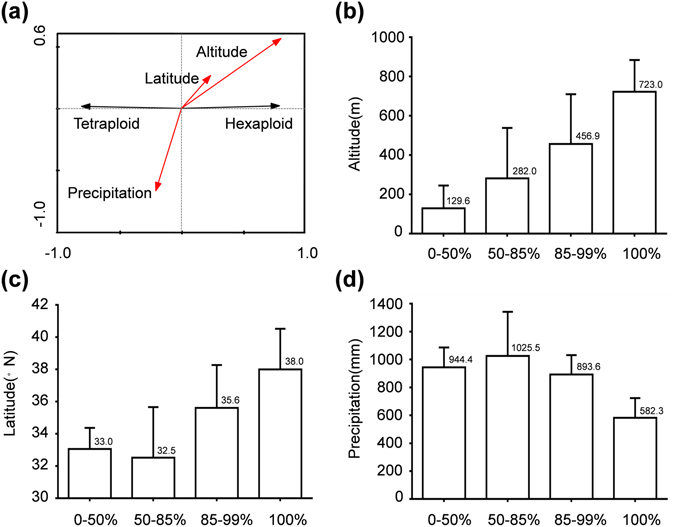
Figure 2.

(a) The redundancy analysis on association between geographic/climatic variables and differential distribution pattern of hexaploids and tetraploids. Hexaploid and tetraploid are shown by black arrows, while altitude, latitude, and precipitation are shown by red arrows. Diagrams between different hexaploid frequencies and the correlated geographic/climatic variables including altitude (b), latitude (c) and precipitation (d). The X-axes indicate the hexaploid frequencies, and Y-axes indicate values of the correlated geographic/climatic variables.
