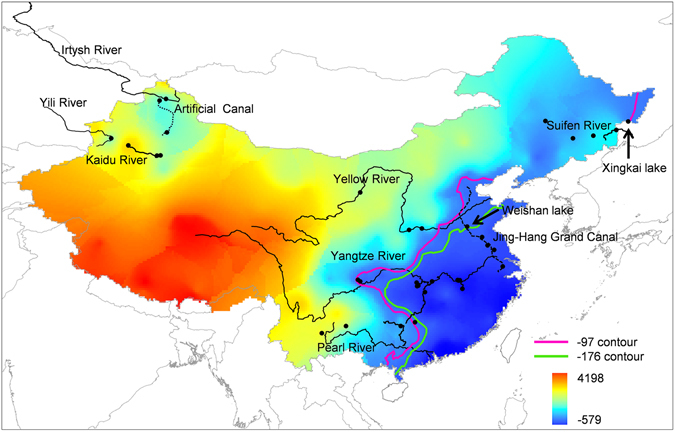
Figure 3.

A predicted map of hexaploid frequency distribution throughout mainland China by using hexaploid group indexes. As hexaploid group indexes were of significantly difference (p = 0, < 0.05) among three assigned hexaploid frequency groups, the lowest value of all-hexaploid frequency group at Xingkai lake (−97) and the highest value of high frequency (51–99%) hexaploid group at Weishan lake (−176) were respectively used as critical values of all-hexaploid group and high frequency (51–99%) hexaploid group through discriminant analysis. The purple −97 contour line stands for the predicted boundary between all-hexaploids and high frequency (51–99%) hexaploids. The green −176 contour line represents the predicted boundary between high frequency (51–99%) hexaploids and low frequency (0–50%) hexaploids. −579 and 4198 indicate the lowest and highest values of predicted hexaploid group indexes respectively. The map was created in ARCMAPv.9.3 (ESRI, Redlands, CA, USA) (http://www.esri.com/products).
