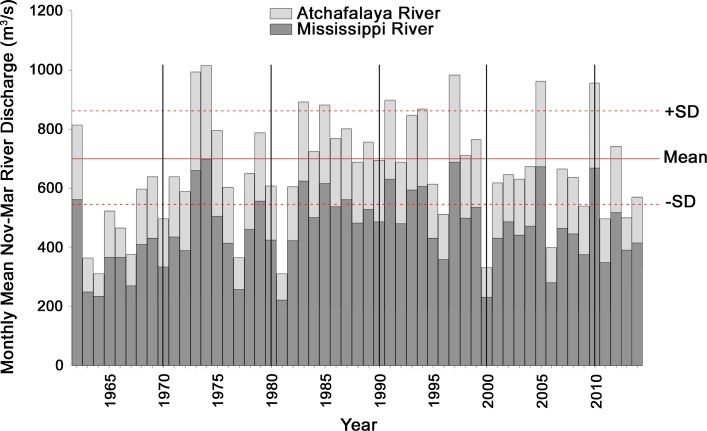
Fig. 8.
Mean monthly discharge of Mississippi and Atchafalaya Rivers, November through March, 1962–2014. SD standard deviation. Discharge data downloaded on 2 October 2015 for US Army Corps of Engineers gaging stations at Tarbert Landing, LA from rivergages.mvr.usace.army.mil/WaterControl/shefgraph-historic.cfm?sid=01100Q for the Mississippi and at Simmesport, LA from rivergages.mvr.usace.army.mil/WaterControl/shefgraph-historic.cfm?sid=03045Q for the Atchafalaya

