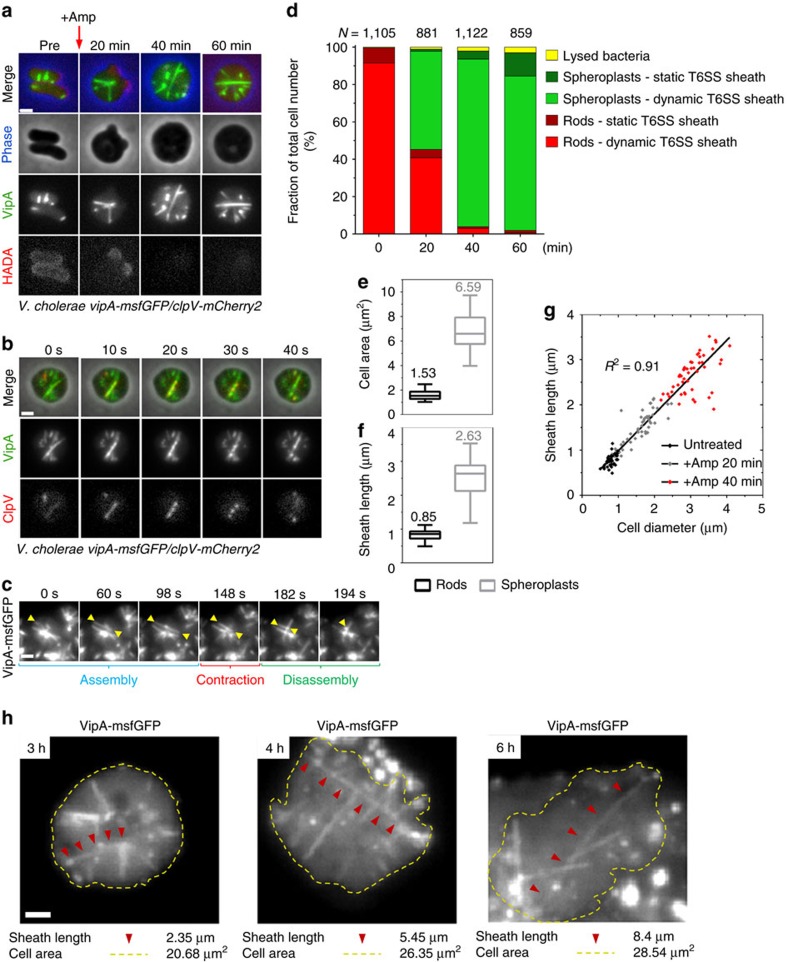
Figure 1. V. cholerae spheroplasts assemble long and dynamic T6SS sheaths.
(a) Cells were grown in the presence of HADA to OD 0.5 before addition of 500 μg ml−1 ampicillin (Amp) and harvested for imaging at indicated time points after antibiotic addition. Cell morphology, VipA-msfGFP localizations (sheath dynamics) and HADA staining (PG) were monitored during spheroplast induction. Top row shows a merge of all three channels (phase contrast is pseudo coloured in blue), channels below are displayed individually as grey scale images. Full time-lapse series of each time point are shown in Supplementary Movie 2. Supplementary Movie 3 shows 50 × 50 μm field of view of spheroplasts after incubation with ampicillin for 40 min. Large fields of view for time points 20 min and 40 min are shown in Supplementary Fig. 1b. (b) VipA-msfGFP/ClpV-mCherry2-labelled V. cholerae spheroplasts (500 μg ml−1 ampicillin, 40 min) were monitored for sheath assembly, contraction and disassembly for 5 min. The top row shows a merge of both fluorescence channels and phase contrast, the fluorescence channels are displayed individually as grey scale images. (c) VipA-msfGFP labelled spheroplasts (500 μg ml−1 ampicillin, 40 min) were imaged for 5 min at a rate of 2 s per frame. Yellow arrow heads indicate a T6SS sheath undergoing assembly into a fully extended state, contraction and disassembly. (d) Cells were grown for indicated time points in presence of 500 μg ml−1 ampicillin and analysed for cell morphology (lysed, rod shaped and spheroplast) and T6SS dynamics (dynamic or static VipA-msfGFP localization). All data were acquired from three independent experiments. N, total number of cells analysed for each time point. (e,f) Cell surface area (e) and length (f) of the longest fully extended VipA-msfGFP structure was measured for 50 rod-shaped cells or spheroplasts formed during 40 min exposure to ampicillin. Data are represented as box-and-whisker plots with minima and maxima; 75% of all data points lay within the box, horizontal lines and numbers represent median values. (g) The coefficient of determination (R2) between sheath length and cell diameter was calculated from 50 cells in each category. Data are fitted with a linear regression line. All data were acquired from three independent experiments. (h) Spheroplasts formation was induced for the indicated time by incubation of cells at 37 °C on 1% agarose pads containing 100 μg ml−1 ampicillin. The VipA-msfGFP fluorescence channel is displayed. Cell outlines are shown in yellow, red arrow heads indicate the longest sheath within the observed cell. Scale bars, 1 μm.

