
Figure 6.
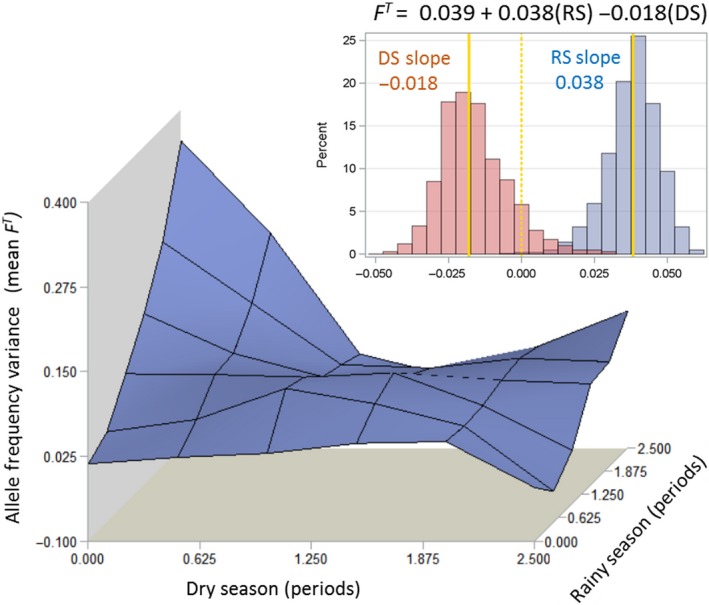
The effects of periods of dry season (x‐axis) and rainy season (y‐axis) on the mean variance in allele frequency, FT, (z‐axis) across loci in all pairwise sample combinations in Thierola (n = 21 comparisons, Table 3. See text for details). Response surface was generated using bivariate interpolation (Proc g3Grid in SAS). Inset: Confidence intervals of the regression coefficients (values marked by the solid yellow lines) measuring the change in the variance in allele frequency versus time for the DS and RS produced by bootstrapping (over the sample pairs, 1,000 pseudoreplicates)