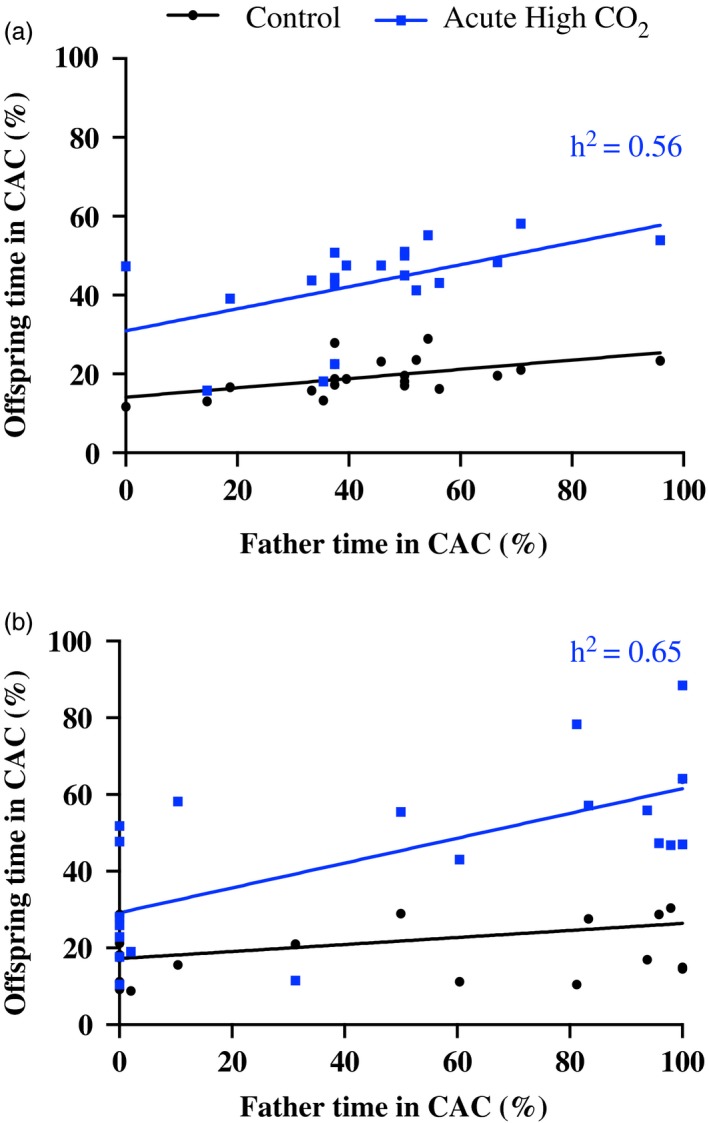
Figure 2.

Father–mid‐offspring regressions for olfactory preference of fish acutely exposed to high CO 2 for (a) the field‐collected population and (b) the laboratory‐reared population. Per cent time spent in the chemical alarm cue was measured. Father responses are from acute CO 2 exposure and are plotted along the x‐axes. Mid‐offspring responses are plotted along the y‐axes for direct relationships with their fathers. Regressions are grouped by offspring treatments: control and acute high CO 2. Laboratory‐reared juveniles are from parents held in ambient control during the breeding season. h 2 = 2b and is depicted on the graphs
