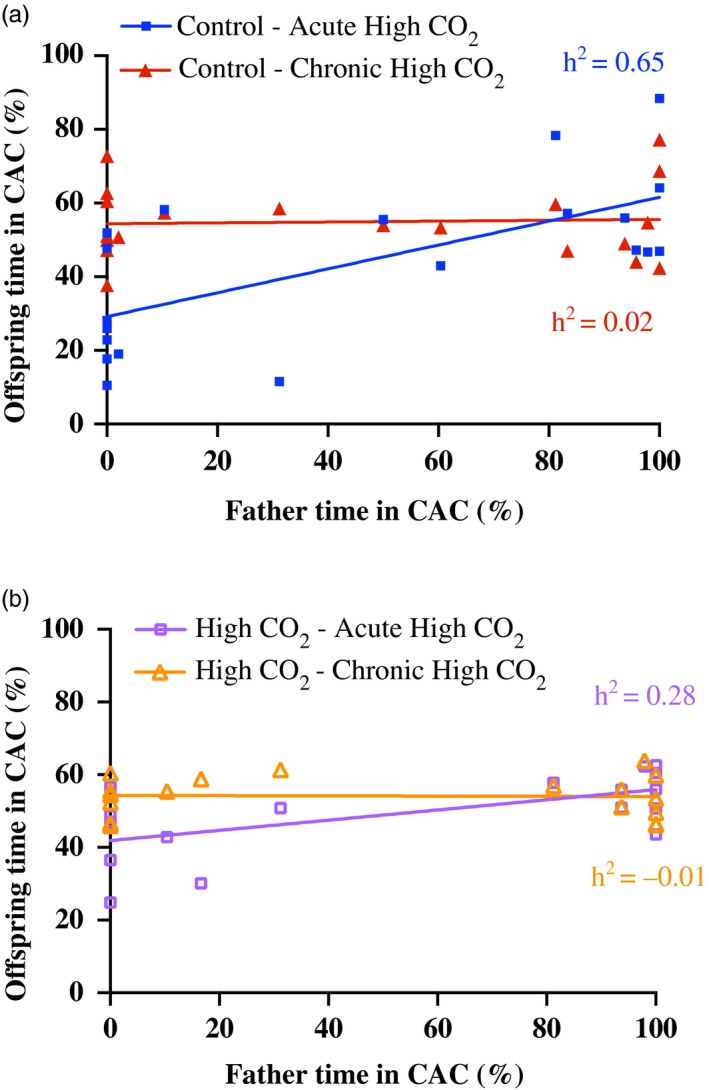
Figure 3.

Acute high‐CO 2 versus chronic high‐CO 2 effects on olfactory responses for father–mid‐offspring regressions in the laboratory‐reared population. Per cent time spent in the chemical alarm cue was measured. Father responses are from acute CO 2 exposure and are plotted along the x‐axes. Mid‐offspring responses are plotted along the y‐axes for direct relationships with their fathers. Regressions are grouped by offspring treatments, with the first word in the legend indicating their fathers’ holding condition (a) control (414 μatm) or (b) high CO 2 (754 μatm), and the second word in the legend indicating offspring rearing treatment (Acute high CO 2 or Chronic high CO 2). h 2 = 2b and is depicted on the graphs
