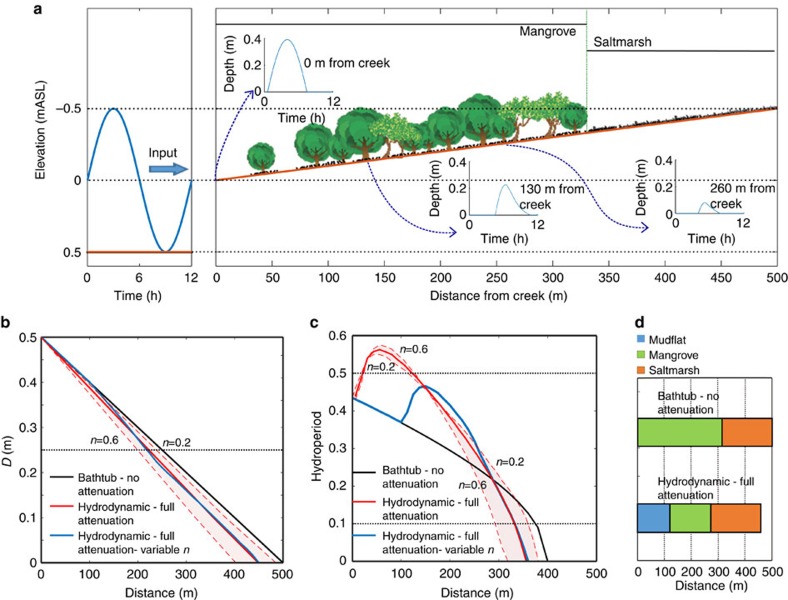
Figure 1. Flow attenuation effects due to vegetation on a subtropical tidal flat.
(a) Schematic of a typical SE Australian wetland with mudflat-mangrove-saltmarsh sequence illustrating the vegetated tidal flat under a semidiurnal 1-m tidal range signal used for model comparison (vegetation not to scale). Depth hydrographs obtained from the hydrodynamic model at the pneumatophore level at 0, 130 and 260 m from the creek show attenuation of the peak and a longer tail close to the creek (130 m) when the full effects of vegetation attenuation are considered. (b,c) Changes in D and hydroperiod obtained from bathtub and hydrodynamic modelling, showing the attenuation effects of a vegetative flow resistance for a range of Manning’s n values from 0.2 to 0.6 (bounds of shaded areas) with a mean of 0.4 (solid red lines), and also the results using a variable n value specific for each substrate (0.035, 0.5 and 0.15 for mudflat, mangrove and saltmarsh, respectively) updated based on the full attenuation vegetation distribution in d (solid blue line). Changes in hydroperiod are computed at the pneumatophore level, initially set at 14 cm from the ground. (d) Vegetation distribution simulated using the bathtub and the hydrodynamic approaches for n=0.4. Modelled vegetation responds primarily to preferences to threshold values for D (in the case of saltmarsh) and hydroperiod (in the case of mangrove) indicated as dotted horizontal lines in b,c, respectively. Metres above the Australian height datum (mAHD) in (a) stands for metres above the Australian height datum, which approximates mean sea level.

