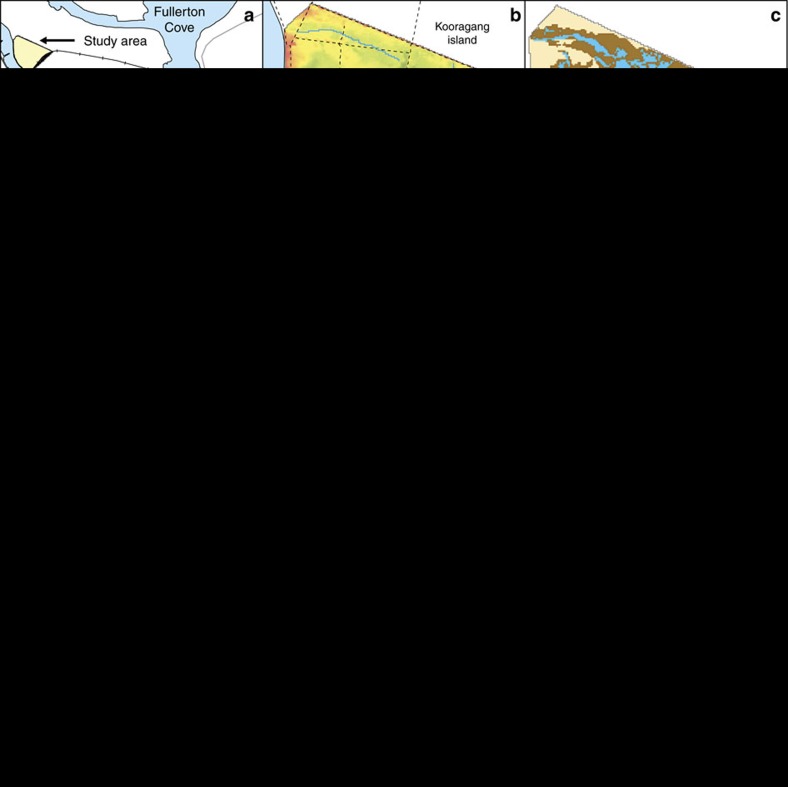
Figure 2. Effect of flow attenuation due to vegetation and infrastructure on a subtropical coastal wetland.
(a) Map of the Hunter estuary showing, in yellow, the location of the wetland used in this study. (b) Tidal flow in the study site is restricted by high embankments over most of its perimeter with two inlets from the Hunter River and a number of internal channels and culverts. Topographic elevations range from −1 to 3.5 mAHD, but most of the tidal flats are within 0–1 mAHD (c) The 2004 survey of the site show mangrove establishment in the lower wetland and saltmarsh at higher elevations, with considerable areas of mudflat and tidal pools. (d,e) When no flow attenuation is considered the annual values of hydroperiod and D during spring tides are only governed by the tidal cycle and the topography. (f) The predicted vegetation distribution based on unattenuated values of hydroperiod and D grossly overestimates the extent of mangrove when compared to the distribution observed in c. (g,h) When flow attenuation is considered the annual values of hydroperiod and D during spring tides show more areas that are permanently inundated (0.8<hydroperiod<1) and have shallow depths (0<D<0.3) in the northern half of the wetland than in the previous case. (i) The predicted vegetation distribution based on values of hydroperiod and D computed with attenuation (g,h) results in the northern part of the wetland dominated by saltmarsh and tidal pools, and mangrove circumscribed to the southern part of the wetland in agreement with the distribution observed in c. mAHD in (b) stands for metres above the Australian height datum, which approximates mean sea level.

