
Figure 2. Sub-cellular localization of polycarbodiimide-single-walled carbon nanotube complexes.
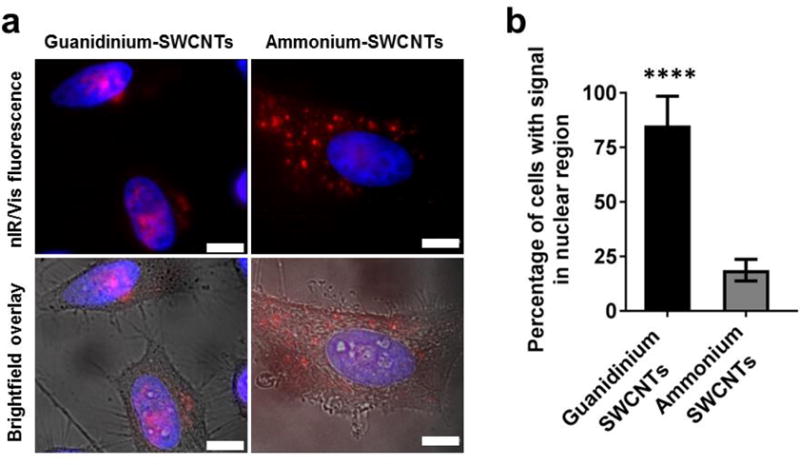
a, Fluorescence and brightfield overlay images of polymer-nanotube complexes in HeLa cells/nuclei. Red = carbon nanotube near-infrared emission, blue = Hoechst 33258 nuclear stain. b, Quantification of nuclear localization of guanidinium-polymer complexes and ammonium-polymer complexes. Graph represents mean ± standard deviation from 3 replicate experiments. Scale bars = 10 μm. ****P<0.0001 (P<0.05 significant).