
Figure 5. Nanotube photoluminescence response on nuclear localization and imaging via hyperspectral microscopy.
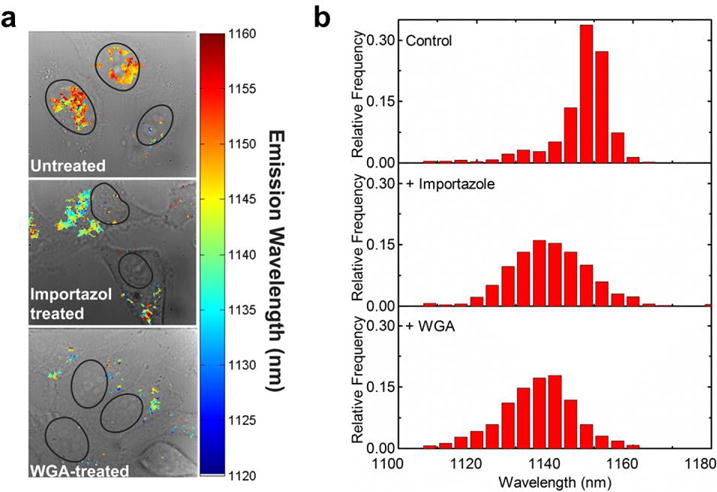
a, Hyperspectral maps of guanidinium-nanotube complex emission in live HeLa cells, overlaid on the brightfield images. Nuclear outlines are shown as black lines. b, Histograms of peak emission wavelength from the hyperspectral data, obtained from three replicate experiments.