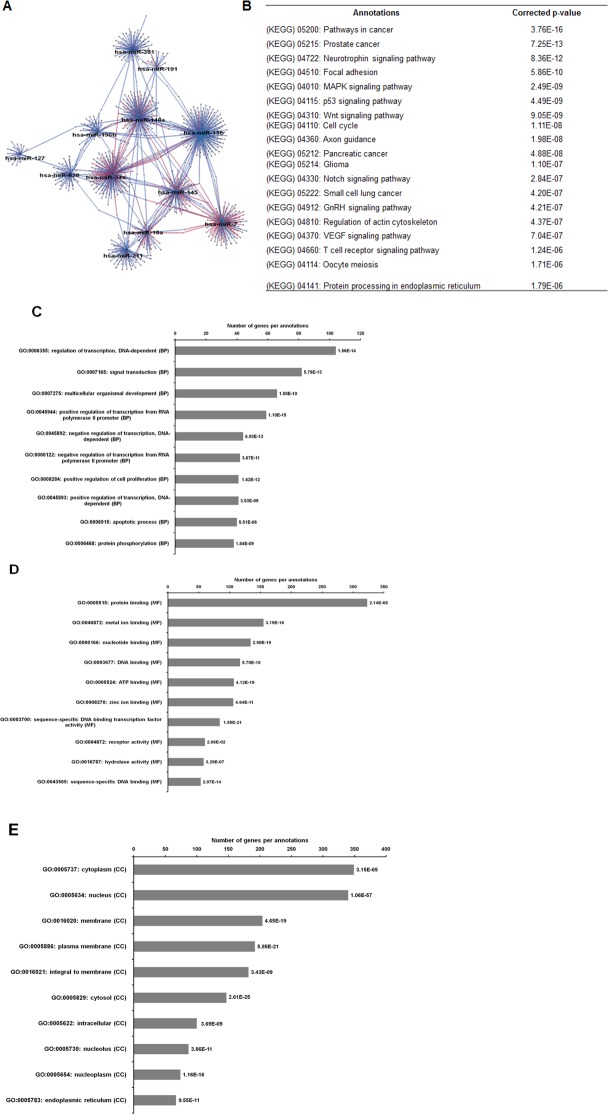
Figure 8. The network, pathway analysis and functional annotation by GO for predicted miRNAs targets commonly expressed in the two spheroid-enriched CSCs cell types.
(A) Network of differentially expressed miRNAs-target genes. Each network includes two types of nodes, red circle represents individual miRNAs and pink circle represents target genes. (B) List of enriched KEGG pathways with their corresponding corrected p-values based on hypergeometric test with the most significant pathways (smallest p-value) listed from top down. Gene ontology analysis in the (C) biological process, (D) in molecular functions, and (E) in cellular components. The number of genes per annotations indicating enriched levels of genes with a modified Fisher exact P-value <0.05 are shown at the end of the nodes.

