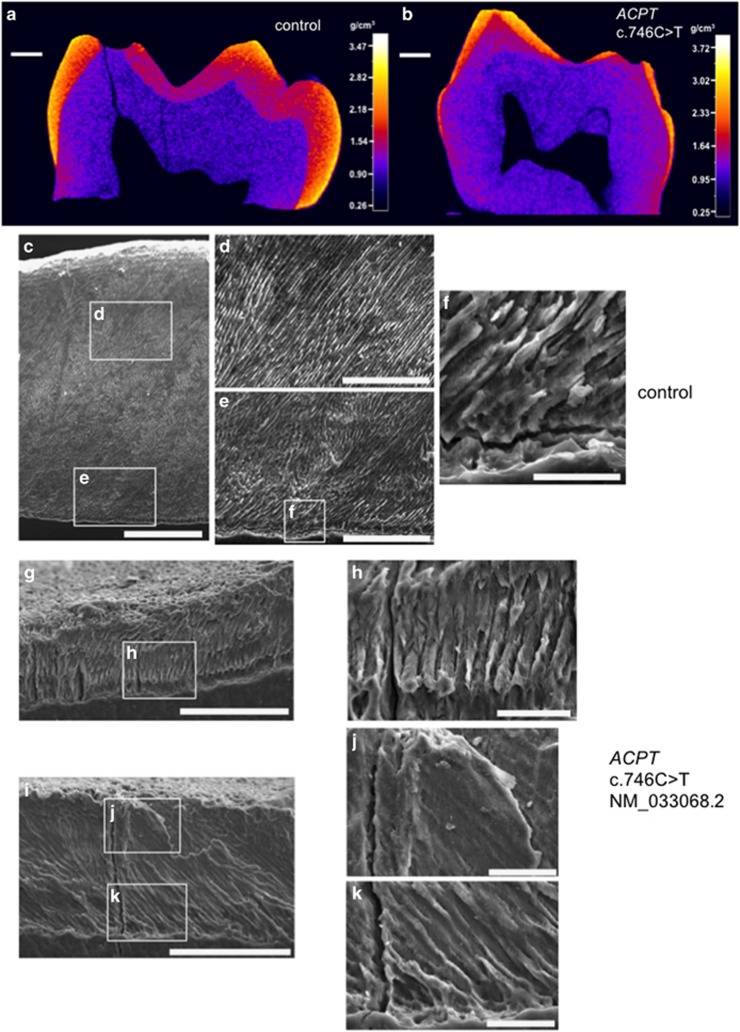
Figure 2.
CT and SEM analysis of enamel of a tooth from individual IV:3, family 1 and a control. (a) and (b) False colour plots to show the variation in enamel mineral density for a cross section through each primary molar tooth. (a) control primary molar that has undergone natural exfoliation. Enamel is generally thick but variably mineralised, with the surface enamel being the most mineralised and the EDJ the least. There is a clear demarcation between the enamel and the dentine (b) primary molar tooth from individual IV:3, family 1 that was extracted in clinic. The enamel is generally thin but is mineralised where present. The demarcation between the enamel and the dentine is less distinct than for the WT tooth. (c–k) SEM images of enamel from a control and individual IV:3 (family 1) carrying the homozygous ACPT variant, c.746C>T, p.(P249L) based on NM_033068.2 NP_149059.1. (c–f) Control enamel. (c) Entire enamel layer is around 800 μm thick. (d) and (e) Images of the control enamel show that the typical prismatic architecture is present. (f) The enamel at the EDJ. (g–k) Individual IV:3 (family 1) enamel. (g) and (i) Entire enamel layer is around 80–110 μm thick. (h) and (k) Enamel at the EDJ and around 50 μm into the enamel layer consists of prismatic-like architecture. This architecture is less defined towards the surface (h). White boxes show positions of magnified images. Scale bars: (a) and (b) 1 mm; (c) 200 μm; (d), (e), (g) and (i) 100 μm; (f), (h), (j) and (k) 20 μm.

