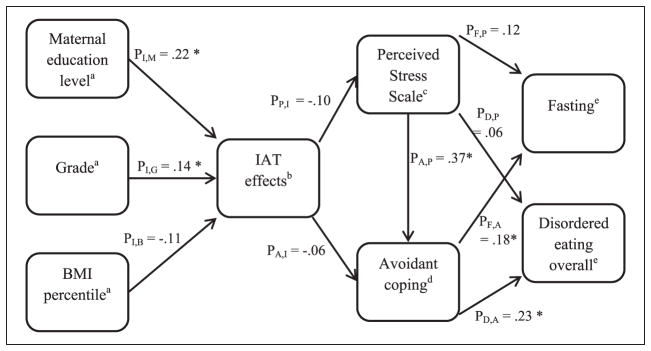
Figure 1.
Path analysis for weight stigma as identity threat.
Note. BMI = body mass index.
a. Represents demographic data and personal characteristics. Maternal education level is a proxy for socioeconomic status; grade is a proxy for age.
b. Represents weight stigma.
c. Represents involuntary response to weight stigma.
d. Represents voluntary response to weight stigma.
e. Represents health outcomes.
*A significant path with a p value <.05.

