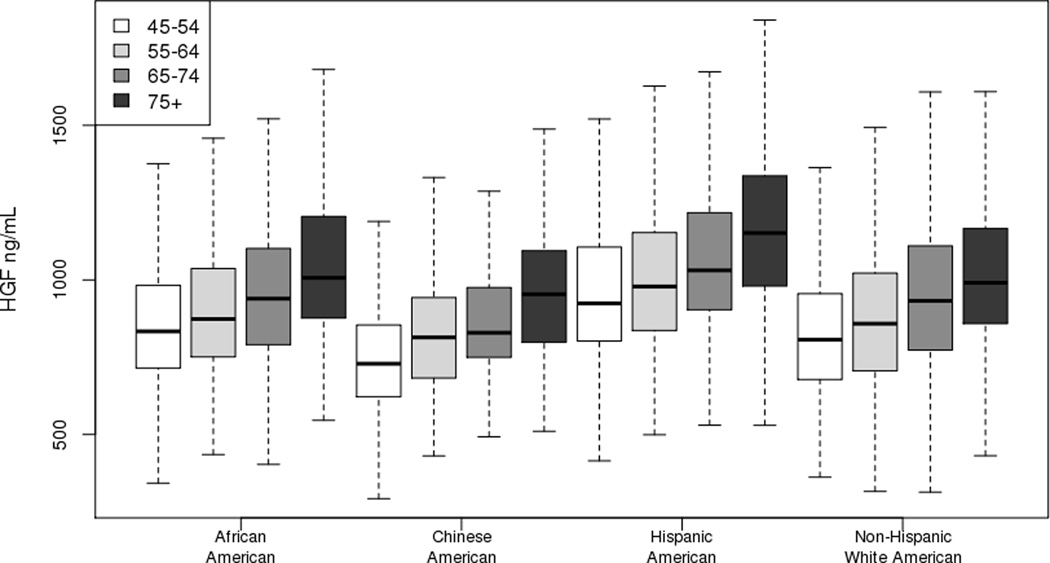
Figure 1.
Boxplot of hepatocyte growth factor by race/ethnicity and age strata. The lower and upper edges of the rectangle are the 25th and 75th percentiles and the horizontal line within the rectangle is the median. The lines extend from each rectangle to the lowest and highest values within 1.5 × interquartile range.

