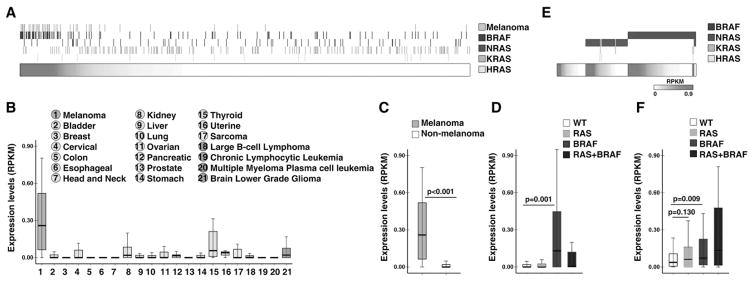
Figure 4. Orilnc1 is highly expressed in melanoma cells with mutant BRAF.
A. Heatmap of Orilnc1 expression in 934 CCLE cell lines (horizontal bar) and their RAS/BRAF mutation status/tissue origins (vertical bars). Each column represents a cell line, and was ranked based on Orilnc1 expression. Red density represents Orilnc1 expression level, and white non-detectable. The rows above the horizontal bar represent the RAS/BRAF mutation status and tissue origins. Yellow: the tissue origin; dark blue: BRAF status; green: NRAS status; blue: KRAS status; and light blue: HRAS status. The presence of a vertical bar indicates the cell line has the corresponding mutation or is a melanoma cell line. B. Box plot of Orilnc1 expression in CCLE cell lines grouped by tumor types. The tumor types are color-coded based on their tissue origin: melanoma is orange; epithelia cancers are green; sarcoma is yellow; hematopoietic cancers are purple; and neurological cancers are blue. C. Box plot of Orilnc1 expression in melanoma and non-melanoma cell lines of CCLE. D. Box plot of Orilnc1 expression in cell lines grouped by RAS/BRAF status. E. Heatmap of Orilnc1 expression in TCGA melanoma specimens (horizontal bar) and their RAS/BRAF mutation status (vertical bars). Each column represents a melanoma patient specimen, and was ranked based on Orilnc1 expression in each subgroup. Red density represents Orilnc1 expression level, and white non-detectable. The rows above the horizontal bar represent the RAS/BRAF mutation status. Dark blue: BRAF status; green: NRAS status; blue: KRAS status; and light blue: HRAS status. The presence of a vertical bar indicates the cell line has the corresponding mutation. F. Box plot of Orilnc1 expression in TCGA melanoma specimen grouped by RAS/BRAF status.

