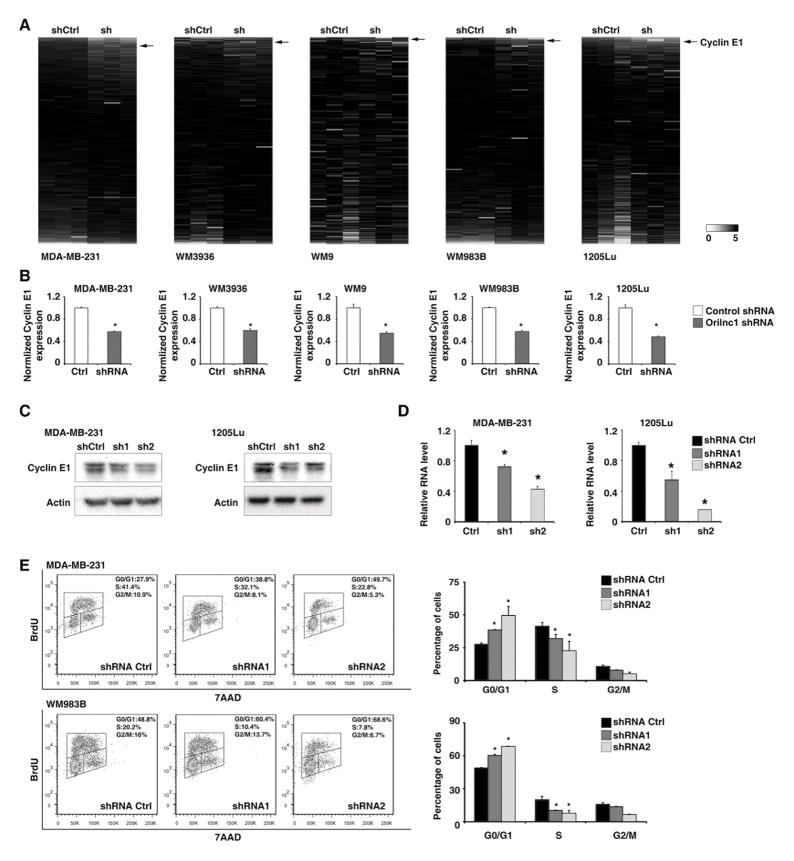
Figure 6. Knockdown of Orilnc1 represses the expression of Cyclin E1 and induced G1/S arrest.
A. Heatmap of the protein expression that was analyzed by a RPPA assay in cells introduced control or Orilnc1 shRNA (n=3 each condition). The proteins (antibodies) were ranked according to the magnitude of the fold change in each given cell line. Red and green indicate up- and down- regulation, respectively. The black arrow indicates Cyclin E1 antibody. B. The quantitative result of the Cyclin E1 expression of the RPPA assay. C. Western blot of Cyclin E1 in cells expressing control or Orilnc1 shRNAs. D. qRT-PCR of CCNE1 in cells expressing control or Orilnc1 shRNAs. E. Cell-cycle profiles of cells expressing control or Orilnc1 shRNAs.

