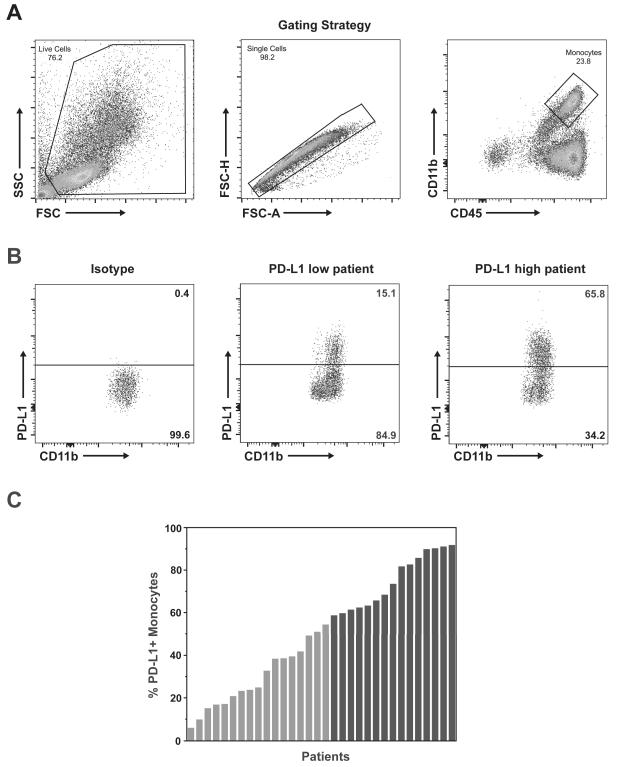
Figure 3. Analysis of PD-L1 Expression on Myeloid Cells in Trial Patients.
(A) Representative gating scheme for identification of myeloid cells from peripheral blood leukocytes by flow cytometry. Live cells were gated from the total population (left panel), followed by identification of single cells (center panel), and gating for total monocyte/myeloid population of CD45+/CD11b+ cells (right panel). (B) Representative analysis of PD-L1+ cells within the gated monocyte population. The cutoff for positive expression was defined by PD-L1 FMO (not shown) and confirmed by staining with PD-L1 isotype control (left panel). Positive cell populations were identified with PD-L1 staining in 32 patients, ranging from low expression (center panel) to high expression (right panel). (C) Summary of PD-L1 expression in monocytes from each of the 32 evaluated patients ordered by percent positive expression. Patients colored in gray (n=17) had expression equal to or less than the median (54.5% PD-L1+ monocytes) and were defined as low expressors. Patients colored in black (n=15) had expression above the median and were defined as high expressors.

