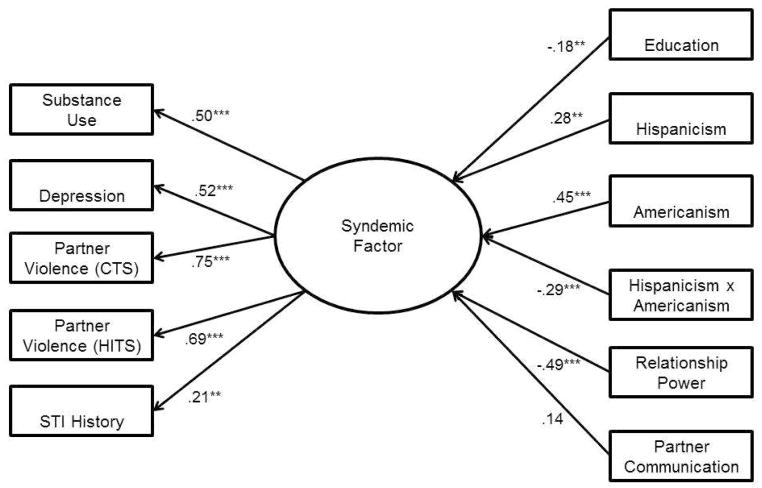
Figure 1.
The right side of the diagram shows relationships between hypothesized predictors of the syndemic factor. The left side shows the relationships in the syndemic factor measurement model. These loadings differ slightly from the initial model, which did not include predictor variables. This model had a good fit to the data,, χ2 (29) = 43.52, p = .041, CFI = .926, RMSEA = .040. *p < .05, **p < .01, ***p < .001.

