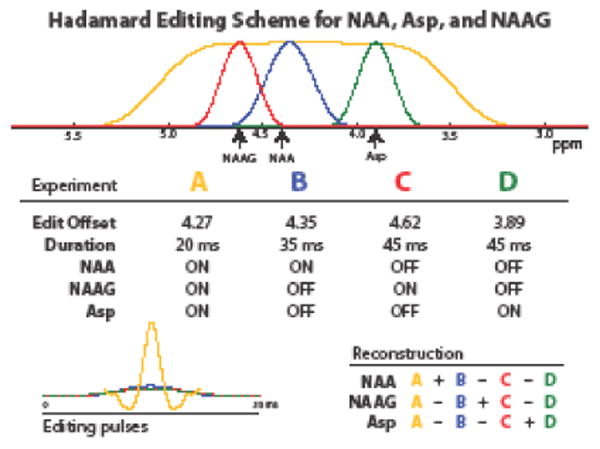
Fig. 2.

Editing pulse schematic for HERMES editing of Asp, NAA, and NAAG. In the top panel, the inversion profile of the editing pulses are plotted, and color-coded by experiment. The middle table shows the four experiments acquired with the listed editing pulse offsets and durations, while the amplitude modulation functions of the four pulses are shown overlaid in the bottom left panel. The bottom right table shows the Hadamard combinations of the different experiments that give the edited spectra of NAA, NAAG and Asp respectively.
