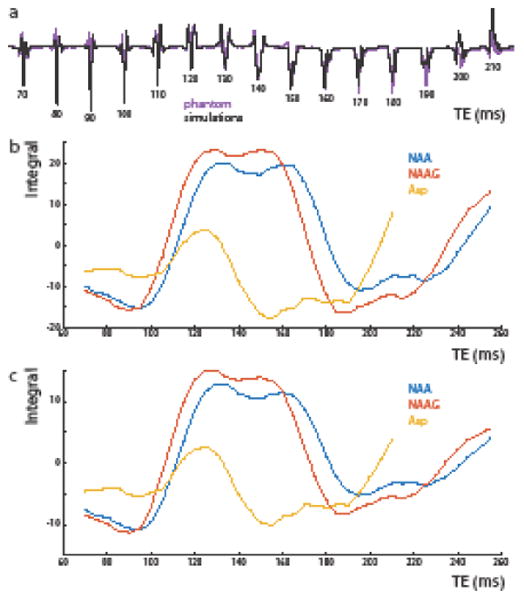
Fig. 3.

Simulations of MEGA-PRESS difference spectra of Asp, NAA, and NAAG at a range of echo times. (a) Simulations (black) and phantom (purple) MEGA-PRESS experiments of the Asp peak (∼2.7 ppm) at echo times varying from 70 to 210 ms. (b) Simulations of the peak areas of MEGA-PRESS difference spectra for Asp, NAA, and NAAG peaks at ∼2.6-2.7 ppm ppm as a function of echo time (70 to 260 ms). (c) Integrals of edited Asp, NAA, and NAAG peaks from (b) as a function of echo time with simulated T2 relaxation, assuming T2 = 277 ms for all metabolites.
