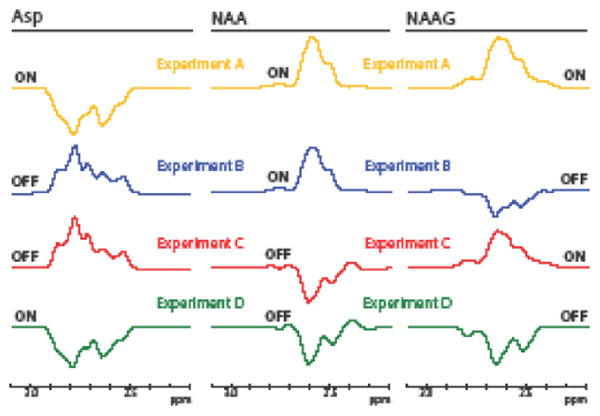
Fig. 4.

The simulated subspectra for Asp, NAA, and NAAG for each of the HERMES steps. Each row corresponds to the outcome of a single sub-experiment (A, B, C, D), as simulated for a different metabolite. The editing pulses that are used for each case are shown (with the same color coding) in Figure 2, bottom left. For NAA and NAAG, a positive refocused signal can be seen in the ONs for each metabolite and an inverted peak can be seen in the OFFs for each metabolite as expected. Relative to NAA and NAAG, the phase of the Asp peak in the ONs and OFFs is inverted, showing a negative signal in the ONs and a positive signal in the OFFs.
