Figure 1.

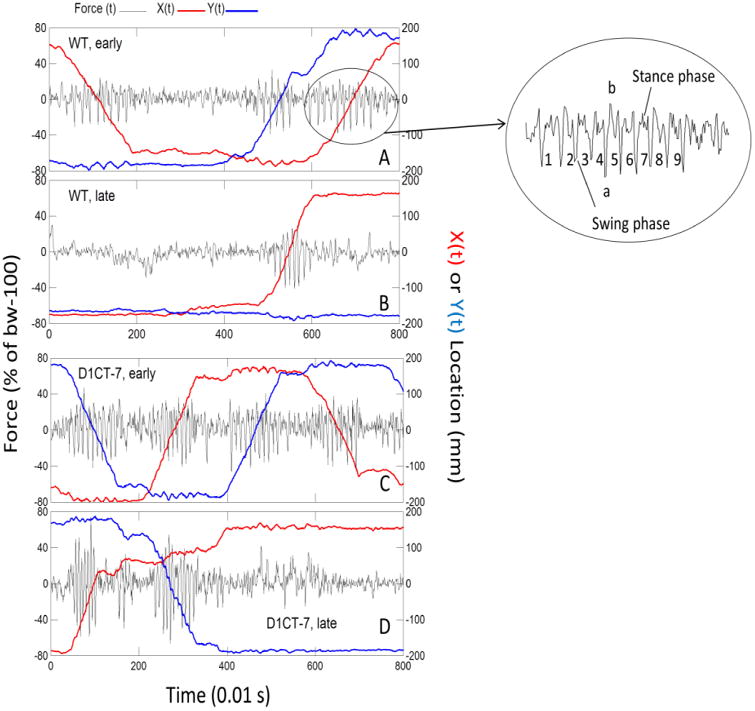
D1CT-7 mice exhibit faster and more forceful strides in force plate actometer tests. Shown here are time series recordings of force and location for one WT mouse (panels A and B) and one D1CT-7 mouse (panels C and D). In each panel, the ordinate on the left is for ground reaction force sampled at 100 samples/s. The black line depicts unsmoothed vertical force variations. Within the ordinate label on the left “bw-100” indicates body weight minus 100. The ordinate on the right gives the scaling of the distance across the floor of the chamber in the X and Y directions. The plotted red line represents X(t), and the blue line represents Y(t). X(t) and Y(t) were subjected to a moving average smooth (averaging kernel = 9). Note that the slopes of X(t) and Y(t) chart the velocity of the run represented by the rhythmic force tracing upon which X(t) and Y(t) are superimposed. Plotting Y(t) by X(t) gives the movement track (not shown here). Panel A: plot of 3 early-phase runs showing ground reaction forces, and corresponding spatial displacements of one WT mouse. The small ellipse is for the third run in Panel A. The enlarged ellipse gives more detail of the force changes during the run and shows the swing and stance phases for 9 half strides (4.5 strides). In the large ellipse, lower case “a” and “b” mark the minimum and maximum, respectively, of this run. Within-run force range (WRFR) is the absolute value of a-b. Panel B: Late-phase data for the same mouse whose early-phase data are in Panel A. In Panel B, note the higher stride rate, greater WRFR, and steeper slope (coded in red) of X(t) compared to Panel A. Panel C: Early-phase data for a D1CT-7 mouse. From left to right the mouse made 4 runs with very little pausing between runs. Note also that the mouse movements reflect one circuit around the actometer chamber in the counter-clockwise direction (-Y(t), +X(t), +Y(t), and –X(t)). The stride rate was faster and the WRFR was larger than for the early-phase WT mouse. Panel D: Late-phase data for the same D1CT-7 mouse whose early phase data are shown in the previous Panel C. The late phase for this D1CT-7 mouse was accompanied by a substantial quickening of locomotor rhythm and higher ground reaction forces of runs.
