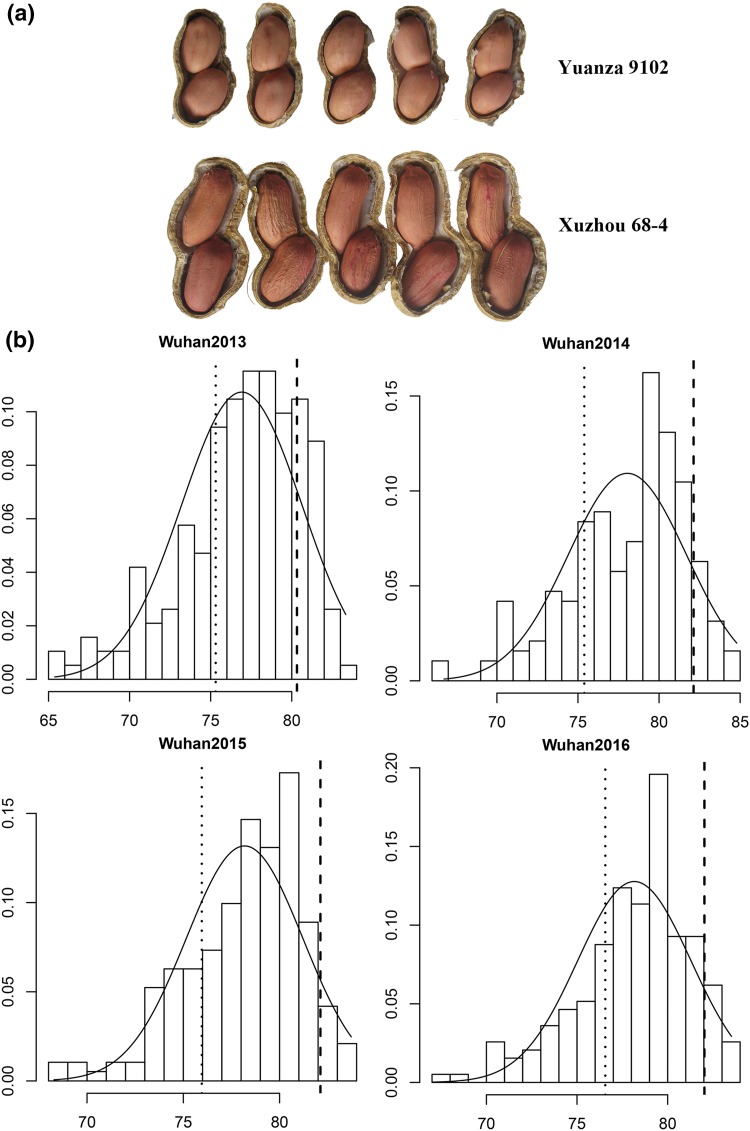
Fig. 1.
Phenotypic variation of shelling percentage in the RIL population. a Phenotypic difference between the parents. b Phenotypic distribution of shelling percentage in the RIL population across 4 years. The y-axis represented density, while the x-axis represented shelling percentage (%). The dotted line represented the shelling percentage of Xuzhou 68-4, and the dashed line represented the shelling percentage of Yuanza 9102

