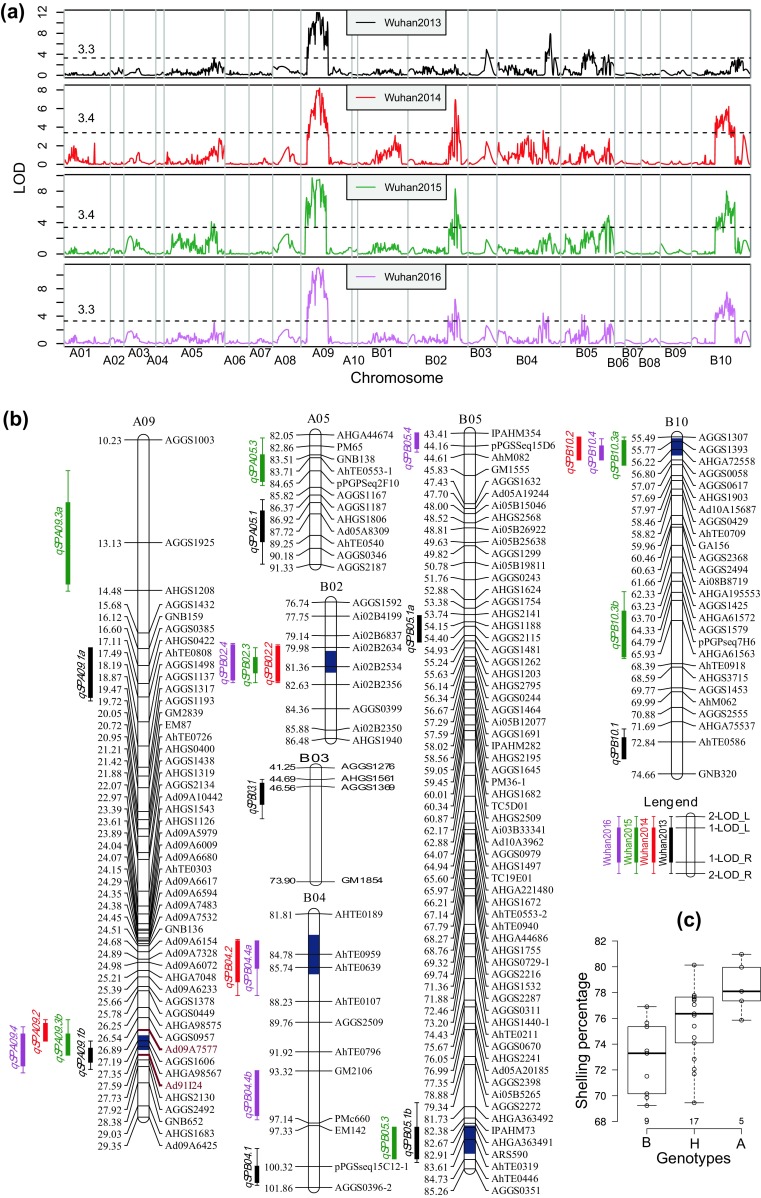
Fig. 3.

Overview of QTLs for shelling percentage in the RIL population. a Genome-wide overview of QTLs for shelling percentage across four environments. b QTLs location of shelling percentage in the corresponding linkage maps. Consistent QTLs obtained by meta-analysis in four environments are highlighted in dark blue color on the chromosome bars. c The boxplot of shelling percentage among three genotypic groups in the progeny of the residual heterozygous line RIL 15-71126. Center lines show the medians; box limits indicate the 25th and 75th percentiles as determined by R software; whiskers extend 1.5 times the interquartile range from the 25th and 75th percentiles; data points are plotted as open circles. n = 9, 17, 5 plants. A, B, H indicated homologous alleles from Yuanza 9102, homologous alleles from Xuzhou 68-4 and heterozygotes, respectively
