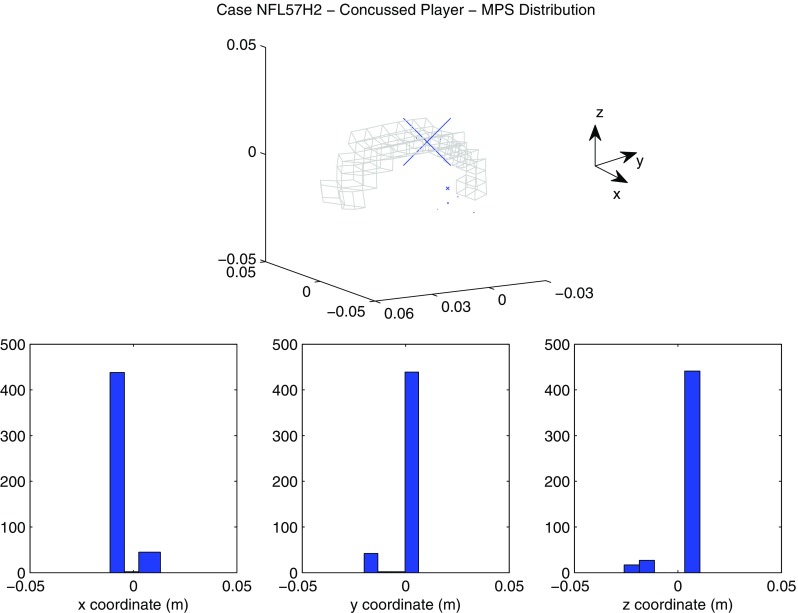
Fig. 17.

Location of maximum principal strain for the concussed player (Case NFL57H2). On the top scatter plot representing the nodes where the maximum principal strain was observed. The size of the markers (blue) is proportional to the frequency of occurence of a certain location. For spatial reference, the mesh of the corpus callosum is plotted in gray. On the bottom: distribution of the coordinates of the points where maximum axonal strain was found. X-axis, Y-axis, and Z-axis correspond to the lateral, anterior–posterior, and inferior–superior directions respectively
