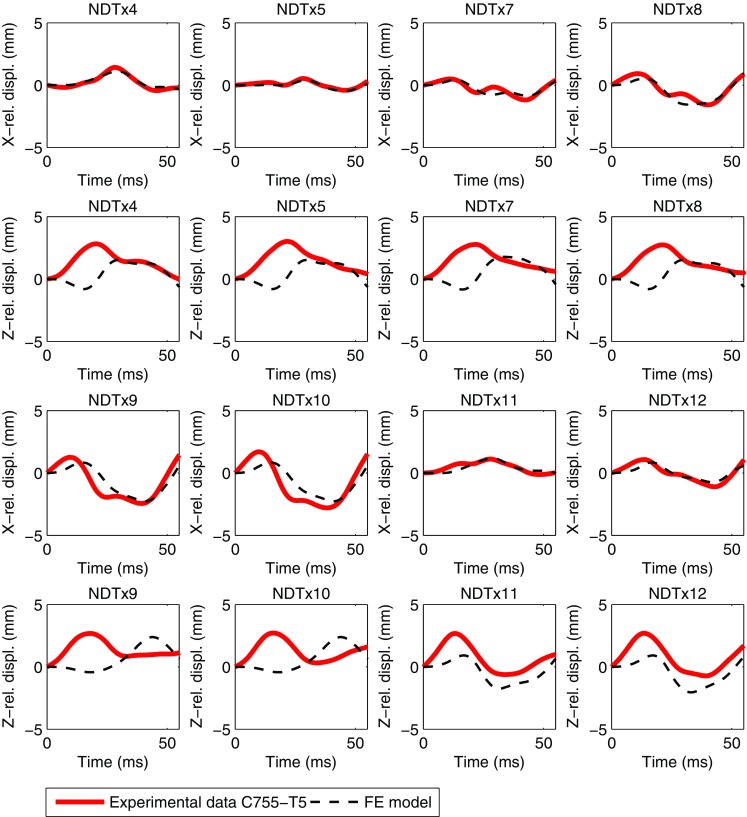
Fig. 19.

Simulation of relative skull-brain motion for the occipital impact C755-T5. For marker locations and coordinate system directions, see Hardy et al. (2001). Experimental data (full lines) are plotted together with the GOH anisotropic model responses (dashed lines)
