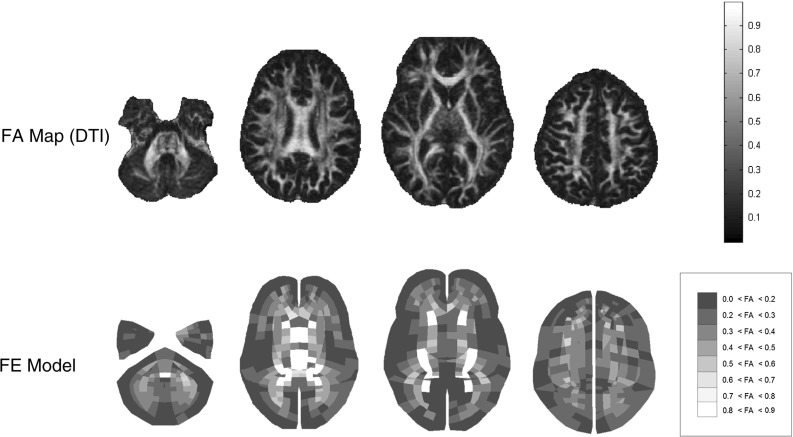
Fig. 6.

Separation between gray and white matter based on fractional anisotropy from DTI. The image refers to the baseline model by Giordano and Kleiven (2014). No elements are found in the most anisotropic group 0.9 < FA < 1.0. From the left to the right, axial cross sections of the FE model and FA map at z = −46.9, −11.2, −3.3 and 28.4 mm are illustrated. The z-axis represents the inferior–superior direction and coordinates are expressed relatively to the center of mass of the head
