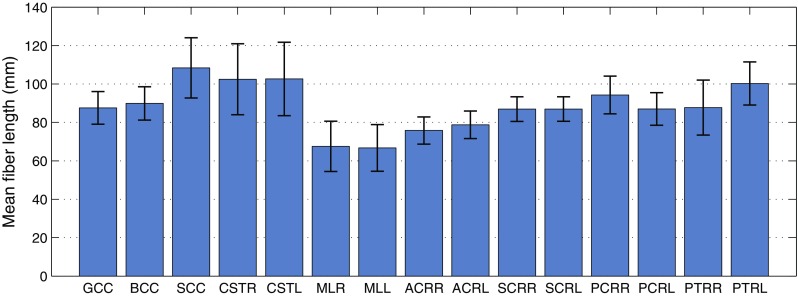
Fig. 8.

Mean length of the fibers corresponding to the 15 selected ROIs for TBI analysis. Error bars represent the inter-subject variability over 485 subjects (SD)

Mean length of the fibers corresponding to the 15 selected ROIs for TBI analysis. Error bars represent the inter-subject variability over 485 subjects (SD)