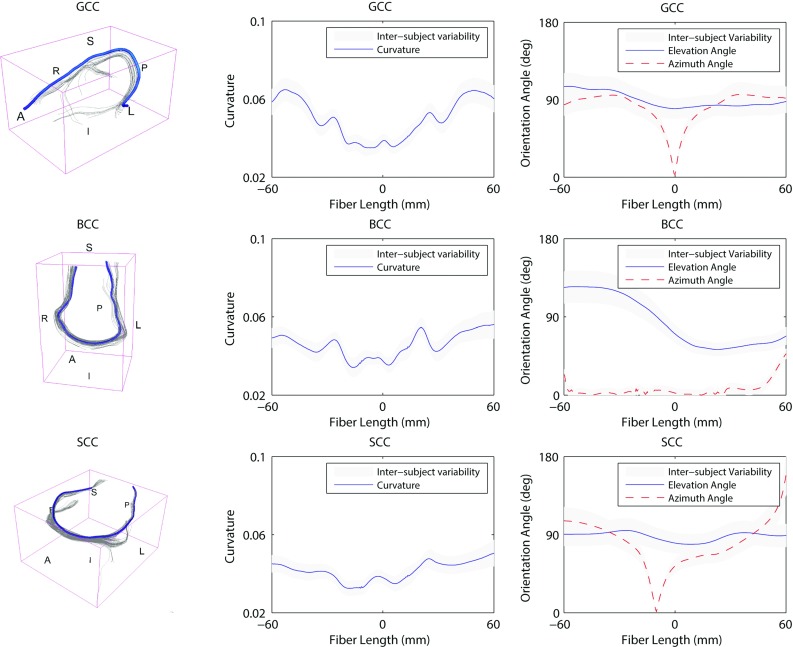
Fig. 9.

Inter-subject variability of the 3D orientation of the callosal white matter tracts. On the left visualization in the 3D space of the reference fiber (A anterior, P posterior, L left, R right). In the middle curvature along the reference fiber. On the right evolution of the elevation angle and azimuth angle (refer to Fig. 4). The inter-subject variability is represented as a gray band indicating ± 1 SD. The origin of the plot corresponds to the center of the ROI. Negative length values are related to fibers in the left part of the ROI
