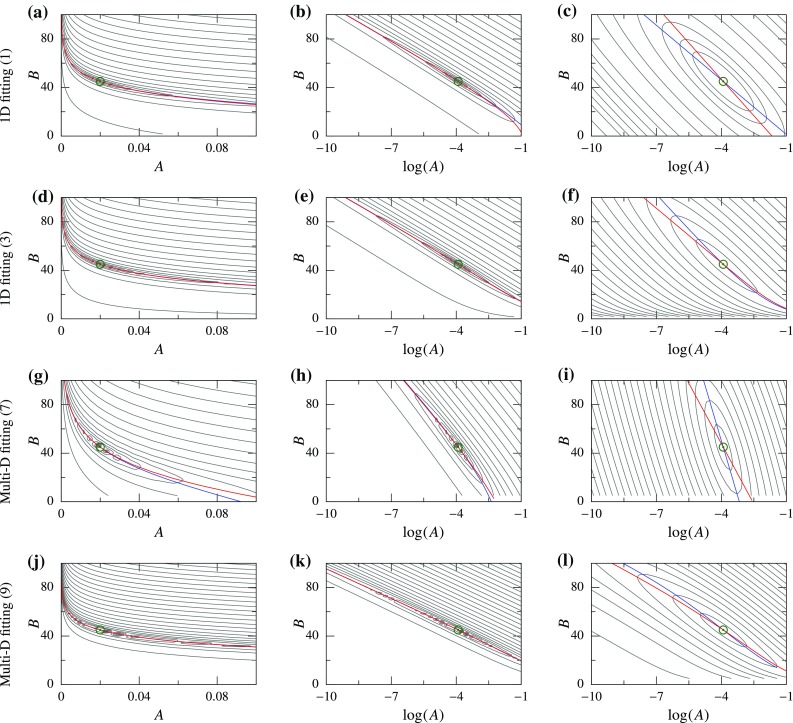
Fig. 6.

Functional for displacement-controlled (DC) cases plotted as a contour; global minimum is indicated using a green circle, and the PM curves are plotted using colored lines—APM (blue) and BPM (red). Left and center column plots are using 2-norm in (A, B) and () space, respectively, while the right column plots are using log-norm
