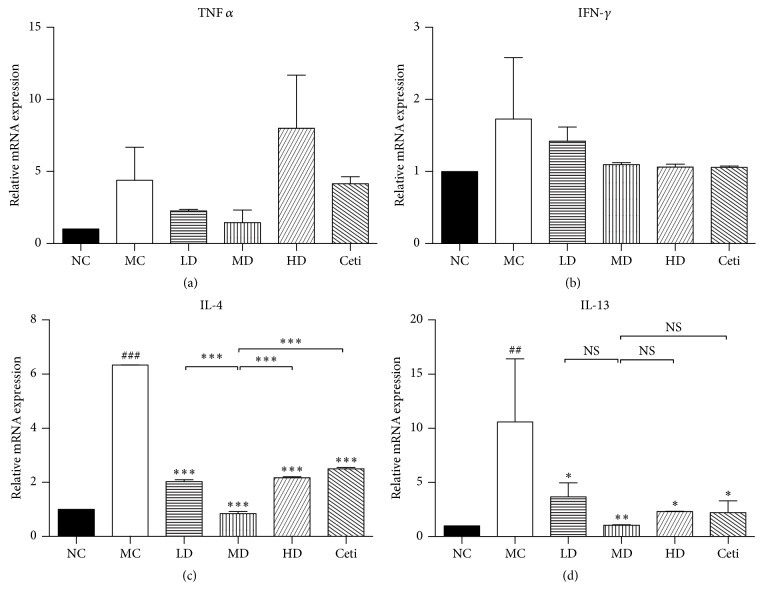
Figure 5.
mRNA expression of cytokines in mice skin after treatment with QRQS or cetirizine. RT-PCR was used to analyze the mRNA expression levels. Relative unit (RU) is expressed as fold differences relative to the calibrator. Statistical results were expressed as mean ± SEMs. ###P < 0.001, ##P < 0.05, MC compared with NC; ∗P < 0.05, ∗∗P < 0.01, and ∗∗∗P < 0.001 compared with MC; NS: not statistically significant.

