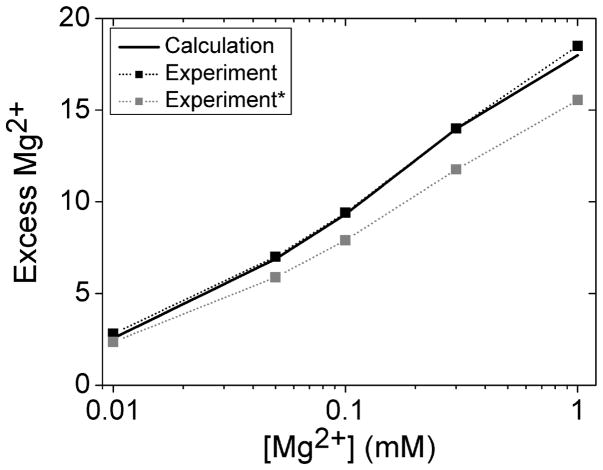
Figure 6.
Comparison between our model prediction (solid black line) and the experimental data (black and gray squares connected by dotted lines) for the number of Mg2+ ions bound to a purine riboswitch (PDB ID: 1Y26) as a function of the bulk Mg2+ ion concentration in a solution with 250 μM DAP (2,6-diaminopurine) and 50 mM K+ background at 20°C.51 The black squares show the experimental data reported in Leipply & Draper (2011). The gray squares show the experimental data modified by a (80%) correction factor that might be necessary for the data (D.E. Draper, private communication).

