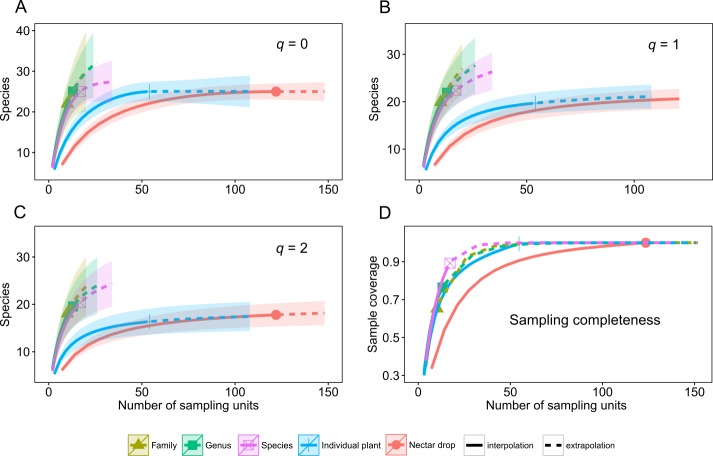
Figure 1. Diversity of tropical nectar-living yeasts.
Diversity of nectar-living yeasts at the different hierarchically nested sampling levels used in nectar collection: nectar drops (Drop), individual plants (Individual), plant species (Species), plant genus (Genus), and botanical family (Family). Plots show (A) species richness (Hill number for q = 0), (B) equally abundant species (q = 1), (C) dominance (q = 2), and (D) sample completeness curve. Diversity curves were constructed using rarefied (solid lines) and extrapolated nectar samples (dashed lines) with sample size-based estimations. Each curve was extrapolated up to double the initial sample size. Observed sample size for each category curve is denoted by a different symbol. The 95% confidence intervals (color-shaded regions) were obtained by a bootstrap method based on 200 replications.

