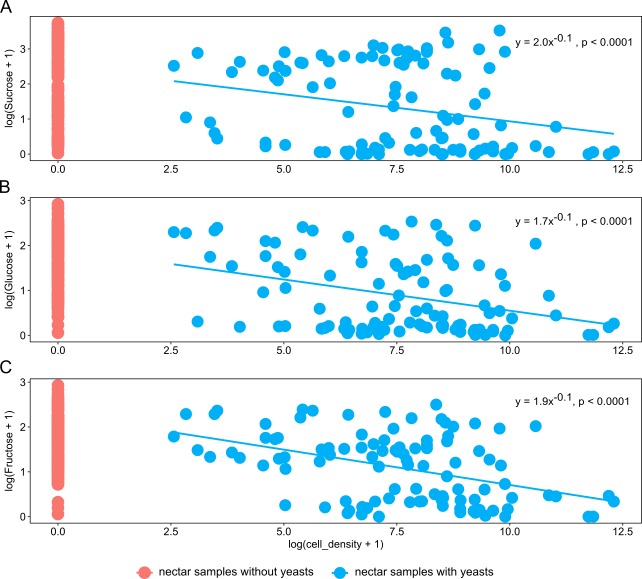
Figure 3. The relationship between nectar sugars and yeast cell density.
Overall relationship between yeast cell density and the concentration of nectar sugars: (A) sucrose, (B) glucose and (C) fructose. Power models are shown in each panel along with their statistical significance. The percentages of variance of each sugar explained by each model (adjusted R2) are 10%, 30%, and 36% for sucrose, glucose, and fructose, respectively.

