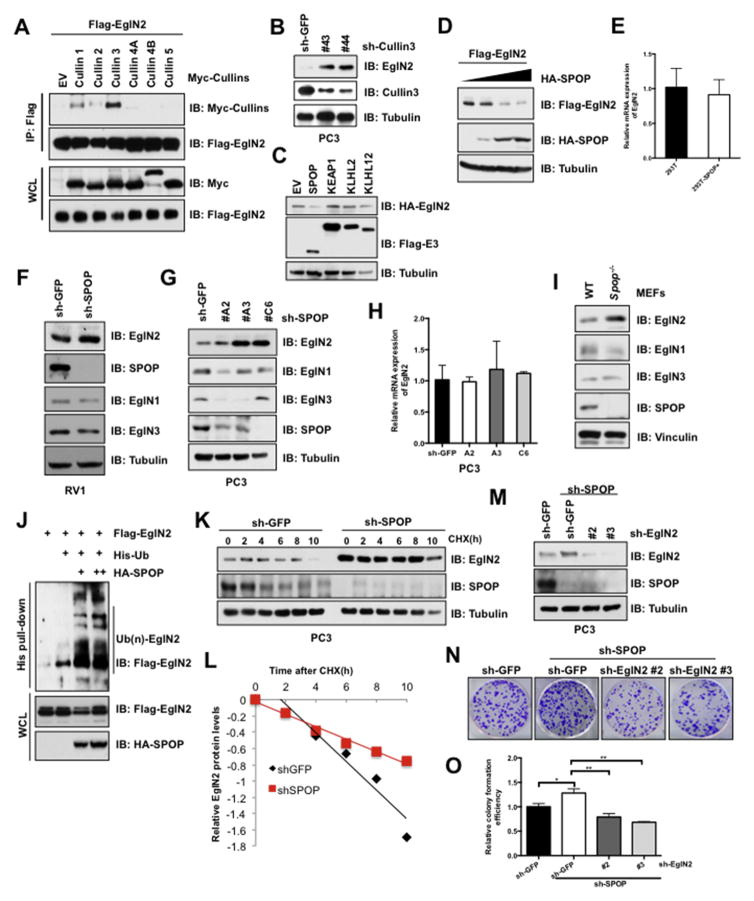
Fig. 3. Cul3SPOP E3 ligase complex interacts with and degrades EglN2.
(A) IB analysis of immunoprecipitates (IPs) and WCLs derived from 293T cells transfected with the indicated Cullin encoding constructs. Cells were treated with MG132 (10 μM) for 10 h before harvesting. (B) IB analysis of WCLs derived from PC3 cells lentivirally infected with the Cullin3 shRNA constructs. (C and D) IB analysis of WCLs derived from 293T cells transfected with indicated constructs. (E) Real-time PCR (qPCR) analysis to examine EglN2 mRNA levels in 293T cells transfected with indicated SPOP constructs (mean ± SD, n = 3). (F and G) IB analysis of WCLs derived from RV1 (F) and PC3 (G) cells lentivirally infected with the SPOP shRNA construct. (H) The mRNA levels of EglN2 in (G) were measured with qPCR (mean ± SD, n = 3). (I) IB analysis of WCLs derived from Spop−/− and counterpart MEFs. (J) IB analysis of WCLs and His pull-down products derived from 293T cells transfected with indicated constructs and treated with MG132 (10 μM) 10 h. (K and L) IB analysis of PC3 cells stably infected with the control and SPOP shRNA construct. Where indicated, Cycloheximide (CHX) (100 μg/ml) was added, and cells were harvested at the indicated time points. Relative EglN2 protein abundance in (K) was quantified by Image J and plotted in (L). (M) IB analysis of PC3 cells lentivirally infected with indicated constructs, and the resulting cells were performed colony formation assays (N). The relative colony numbers in (N) were further quantified in (O) (mean ± SD, n = 3). **p < 0.05, **p < 0.01 (t test).

