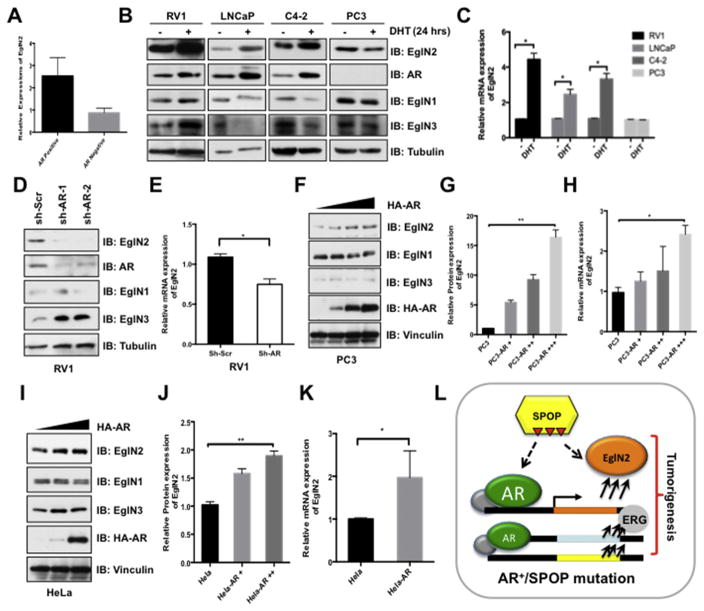
Fig. 6. Androgen Receptor (AR) transcriptionally up-regulates EglN2 expression.
(A) GEO (GSE4016) database analysis of relative EglN2 mRNA expression in AR-negative and AR-positive prostate cancer cells. (B) Prostate cancer RV1, LNCaP, C4-2 and PC3 cells were cultured in charcoal-treated medium for 72 h, then were stimulated with or without DHT (10 nM) for another 24 h before harvesting for IB analysis. (C) The mRNA levels of EglN2 in (B) were measured with qPCR (mean ± SD, n = 3). *p < 0.05 (t test). (D and E) IB analysis of WCLs derived from RV1 cells lentivirally infected with scramble (sh-Scr) or independent AR shRNAs (sh-AR). Infected cells were selected with puromycin (1 μg/ml) for 72 h before harvesting (D). The mRNA levels of EglN2 in (D) were measured with qPCR (E) (mean ± SD, n = 3). *p < 0.05 (t test). (F–K) IB analysis of WCLs derived from PC3 (F) and HeLa (I) cells transfected with indicated AR constructs. The relative EglN2 protein abundance in (F, I) was quantified by Image J and normalized with control cells in (G, J). Furthermore, the mRNA levels of EglN2 in (F, I) were measured with qPCR (H, K) (mean ± SD, n = 3). *p < 0.05 (t test). (L) Schematic diagrams illustrate the regulation of EglN2 in prostate cancer. Loss-of-function mutations in SPOP impaire its capable to destruct its downstream targets, including AR and EglN2, in turn, the accumulation of AR transcriptionally up-regulates EglN2. Ultimately, the elevated EglN2 cooperates with other oncogenic genes together contributing to prostate tumorigenesis.

