
Figure 1.
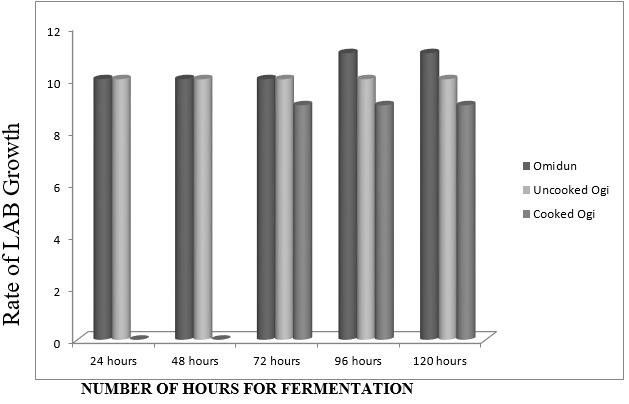
Microbial (Lactic Acid Bacteria) load of white ogi control. Y- axis represents the rate of LAB growth revealed as the exponent of 10 (exponents are within the range of 0 < y<12)
Official websites use .gov
A
.gov website belongs to an official
government organization in the United States.
Secure .gov websites use HTTPS
A lock (
) or https:// means you've safely
connected to the .gov website. Share sensitive
information only on official, secure websites.
Microbial (Lactic Acid Bacteria) load of white ogi control. Y- axis represents the rate of LAB growth revealed as the exponent of 10 (exponents are within the range of 0 < y<12)