Figure 1.
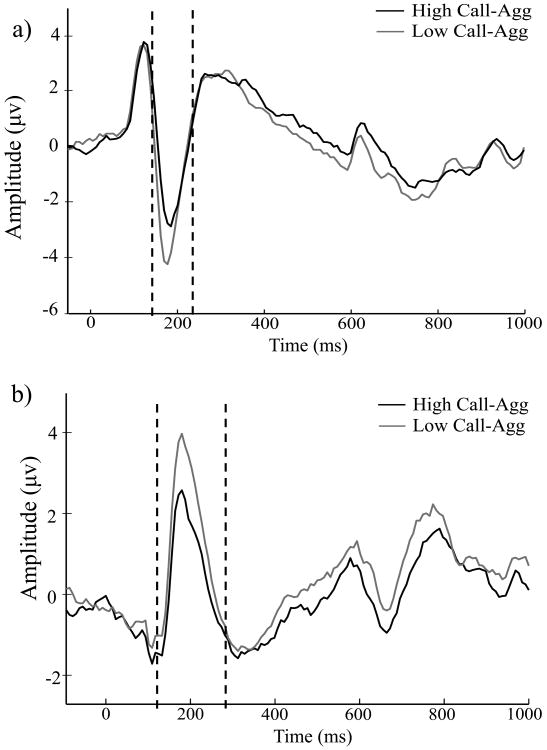
ERP waveform plots. (a) N170: Waveform for ERP activity across fearful face trials at the right occipito-temporal electrode site (P8), showing mean N170 peak response (time window = 150-230 ms) for individuals scoring in the top (dark gray) versus bottom (light gray) quartiles on the Callous-Aggression scale. (b) P200: Waveform for ERP activity across fearful face trials at the midline electrode site (PZ), showing mean P200 peak response (time window = 150-300 ms), for participants scoring in the top (dark gray) versus bottom (light gray) quartiles on the Callous-Aggression scale.

