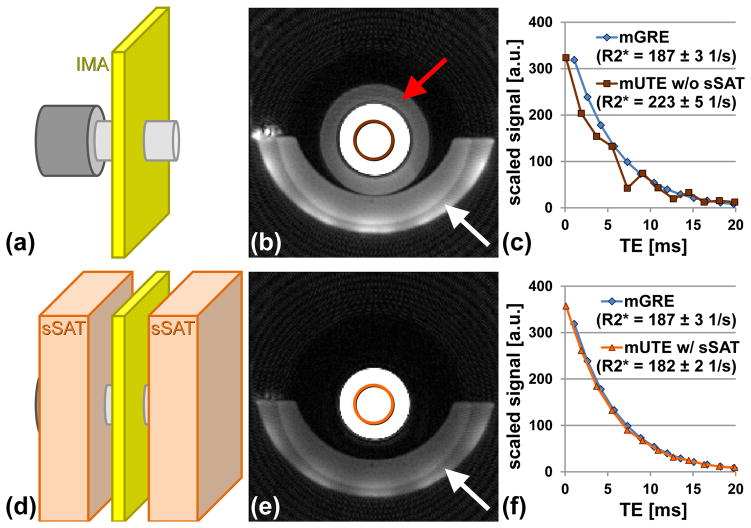
Figure 2.
Effect of sSAT bands to suppress unwanted out-of-slice signals. (a,d) Schematic (dimensions not to scale) of experimental setup (IMA – imaging slice, sSAT – sSAT bands) with two phantom bottles (light and dark gray) placed one behind the other. Axial UTE images (b) without and (e) with sSATs. Substantial out-of-slice signals from the larger phantom positioned behind the smaller phantom bottle can be seen (red arrow). Signal below the phantom bottle (white arrows) arises from cushion used for positioning of the phantoms. T2* decay seen for averaged signal at the center (circles) of the phantom bottle for the mUTE (c) without and (f) with sSAT pulses. For comparison, the signal decay measured with a reference mGRE sequence is also shown (mGRE images not shown). Without sSATs, the out-of-slice signals lead to distortions of the signal decay hampering T2* analysis. Mean R2* values and standard deviation for each acquisition are given in plot legend.

