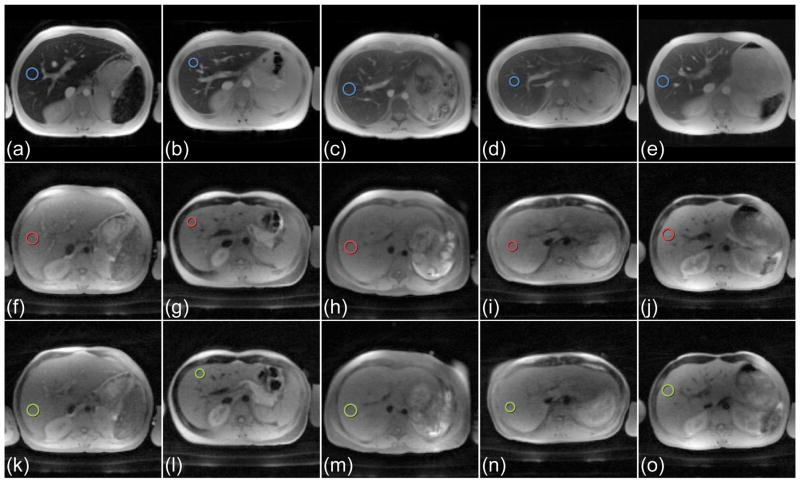
Figure 5.
In vivo imaging with the BH-mGRE, BH-mUTE, and FB-imUTE sequences in the five subjects with massive HIC at 1.5 T. Images acquired at first echo time with the (a–e) conventional BH-mGRE (TE1 = 1.1 ms), with the (f–j) BH-mUTE (TE1 = 0.1 ms), and with the (k–o) FB-imUTE (TE1 = 0.1 ms) sequence. The two UTE sequences were applied with sSAT bands and CHESS pulses as described. Barely any additional artifacts due to breathing motion can be seen in the free breathing acquisitions (k–o) in comparison to the breath hold acquisitions (a–j). Blue, red, and green circles indicate ROIs which were used to illustrate the signal decays given in Fig. 6.

