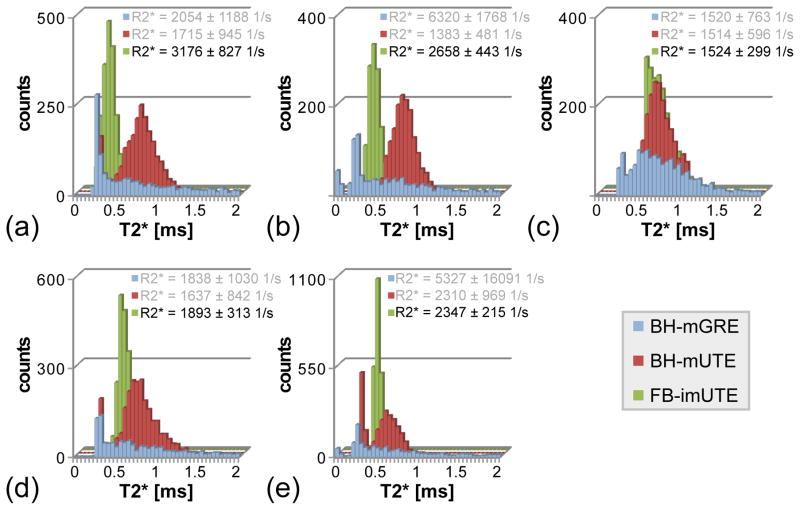
Figure 8.
Histogram plots of the T2* values found at 3 T in the liver parenchyma after exclusion of unwanted structures for the different sequences. For the two BH sequences, the histogram distribution does not display a clear maximum so that mean R2* quantitation is hampered whereas the FB-imUTE data exhibits a well-defined maximum allowing for a meaningful assessment of mean hepatic R2*. Mean R2* values (mean ± standard deviation) of each subject are given in the plot legend for all acquisitions, but only the FB-imUTE sequence gives a trustworthy result.

