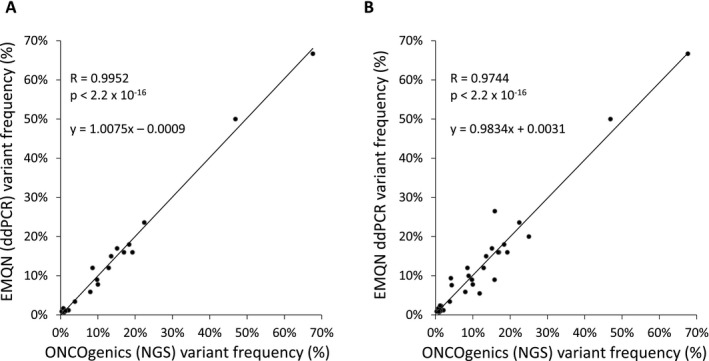
Figure 1.

Correlation of variant frequencies detected by ddPCR and ONCOgenics. (A) Correlation between the frequencies of the variants present in three FFPE samples from the 2016 EQMN Oncogene Panel Testing External Quality Assessment Scheme as reported by EMQN (quantitated by ddPCR) and the frequencies of the same variants as determined by the NGS panel testing. (B) Same correlation as in (A) but after considering a fourth FFPE EMQN sample which had been mildly formalin compromised. The Pearson correlation coefficients (R), the P‐values (Pearson correlation test) and the linear regression equations (y = ax + b) are shown.
